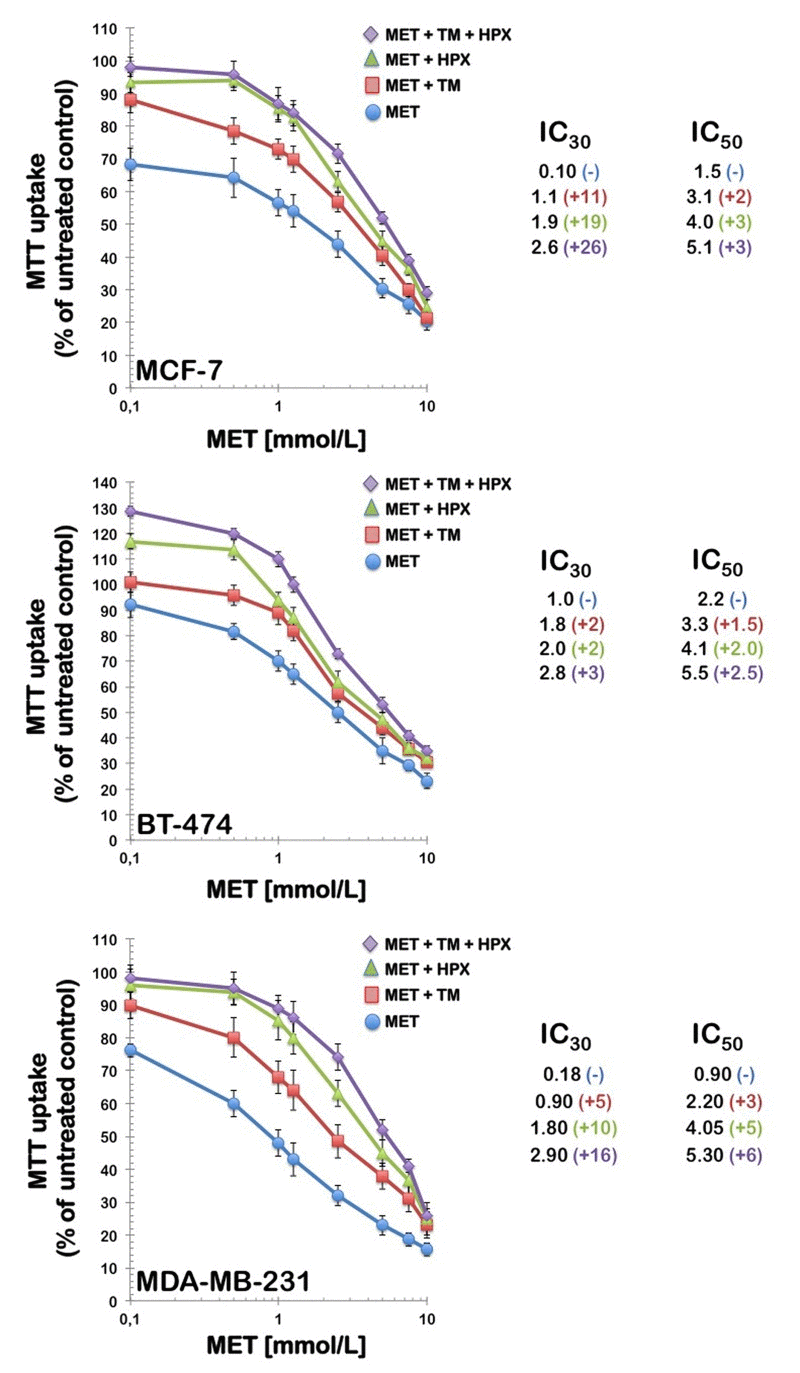
Figure 3.Partial reversal of the growth inhibition of metformin by thymidine and purinesLeft. MCF-7, BT-474, and MDA-MB-231 breast cancer cells were treated with the indicated concentrations of metformin alone or in the presence of thymidine (5.6 μmol/L), hypoxanthine (32 μmol/L), or a combination of thymidine with hypoxanthine. Metformin and modifying agents were added simultaneously and cell growth was determined after 96 h relative to controls without drug processed strictly in parallel using MTT-based cell viability assays. Right. The degree of resistance to metformin induced by thymidine and/or hypoxanthine was evaluated by dividing the IC30 and IC50 values obtained when cells were co-exposed to metformin and pre-formed nucleotides by those obtained in matched control cells cultured in the absence of an exogenous supply of thymidine and/or hypoxanthine. MET, Metformin; TM, Thymidine; HPX, Hypoxanthine.