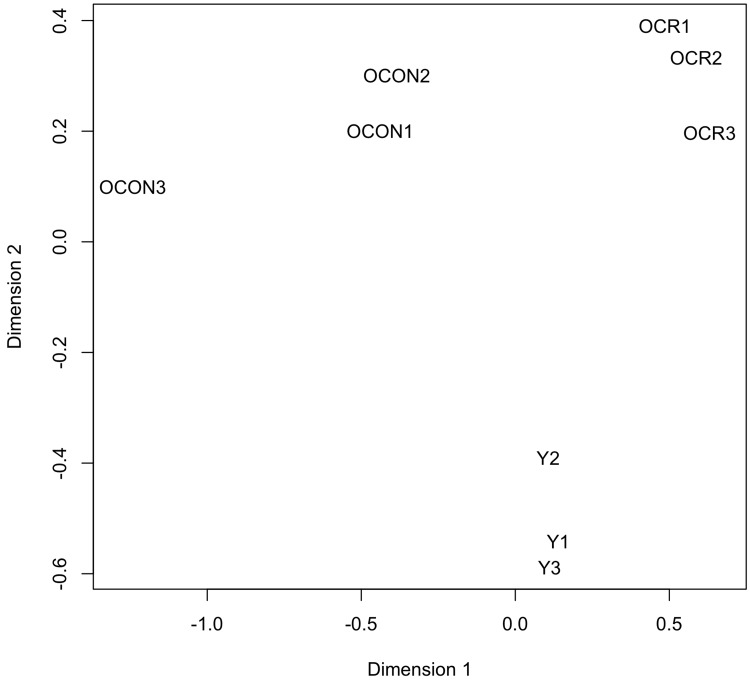
Figure 2.Clustering analysis of the expression values of the circulating miRNAsThe plotMDS function of edgeR was used to produce a multi-dimensional scaling plot in which distances reflect the biological coefficient of variation between the miRNA samples. Dimensions 1 and 2 represent the diet and age factors, respectively. The analyzed miRNA samples are from young control (Y1, Y2, and Y3), old control (OCON1, OCON2, and OCON3), and old CR (OCR1, OCR2, and OCR3) mice.