Submit an Article
Navigate
Home
Editorial Board
Editorial Policies
Current Volume
Archive
Scientific Integrity
Publication Ethics Statements
Interviews with Outstanding Authors
Newsroom
Sponsored Conferences
Podcast
Contact
Special Collections
Submit an Article
Online ISSN: 1945-4589
Research Paper
|
Volume 5, Issue 3
|
pp. 209–226
B cell responses to the 2011/12-influenza vaccine in the aged
Back to article
Figure 3
(3 of 9)
−
100%
+
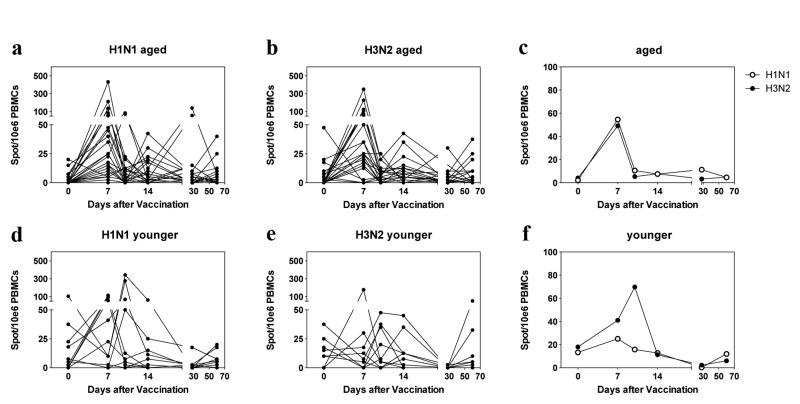
Figure 3.
ELISpot Results
Spots per 10
6
live PBMCs are shown for individual samples in (
a
), (
b
) (aged) and (
d
), (
e
) (younger).
c
and
f
show mean results for aged and younger subjects. The graphs are arranged as in Figure
1
.