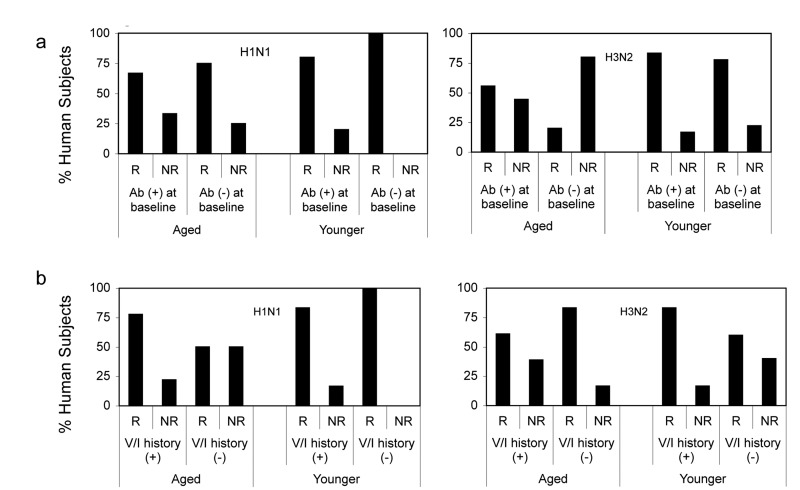
Figure 8.Responsiveness in Relation to Baseline Responses(8a) shows percentages of young and aged responders (R) defined as individual that showed 4 fold increases in neutralizing antibody titers following vaccination and non-responders (NR), which showed ≥ 4, fold increases. Ab (+) reflects individual with titers >1:40 at baseline, Ab (−) individuals had titers >1:40 at baseline. (8b) shows percentages of young and aged responders and non-responders in relation to their influenza vaccination (V) or infection (I) history. (+) indicates individuals who reported vaccinations or infections during the last 5 years; (−) indicates individuals that had neither been vaccinated nor infected during this time. Individuals that could not recall infections or vaccination during this period were excluded from this analysis.