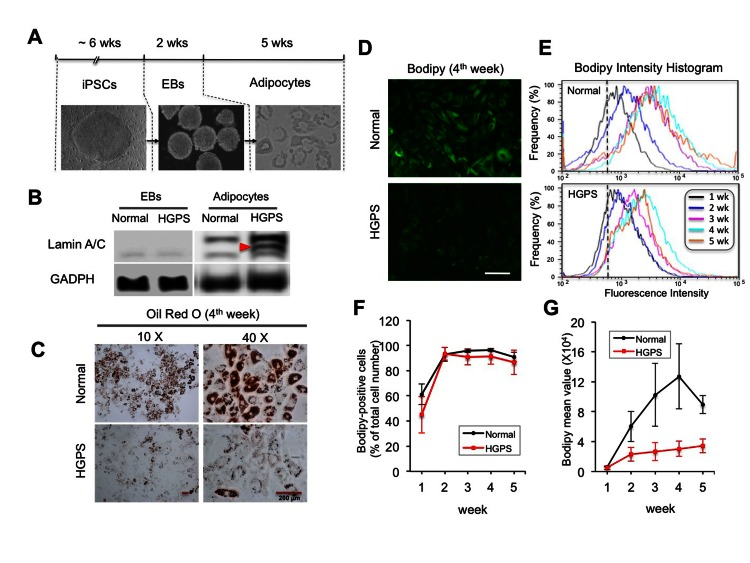
Figure 2.Adipocytes differentiated from HGPS iPSC derived EBs show defective lipid storage(A) Schematic diagram of the experimental timeline starting from iPSCs, via intermediate stage EBs, into the differentiated adipocytes with phase contrast pictures underneath each stage. (B) Western Blotting analysis with lamin A/C and GAPDH antibodies in normal and HGPS EBs and adipocytes. Red filled triangle points to progerin. (C) Images of Oil red O staining show red lipid droplets in normal and HGPS adipocytes at the fourth week of adipogenic differentiation. (D) Images of bodipy 493/503 fluorescence staining in normal and HGPS adipocytes at the fourth week of adipogenic differentiation. (E) Representative histograms of fluorescence intensity of bodipy 493/503 staining during five-week adipocyte differentiation. (F) The percentage of bodipy positive cells from three independent experiments. (G) The mean fluorescence intensity of bodipy staining in normal and HGPS adipocytes during the five weeks of adipogenesis from three independent experiments. Cell lines: Normal (8470) and HGPS (164).