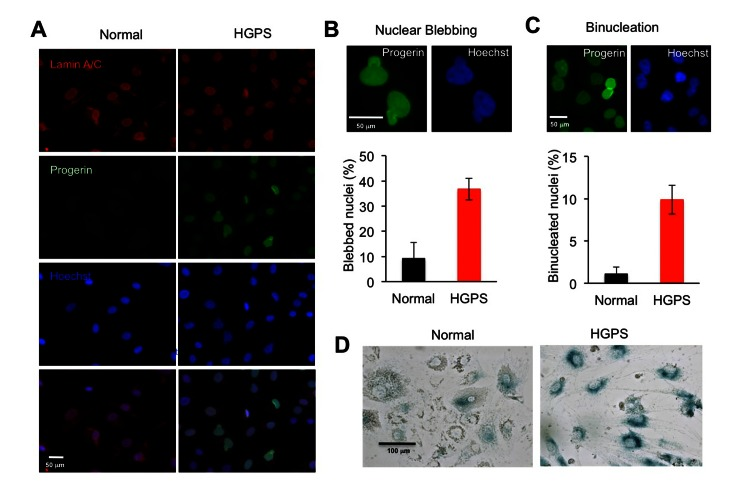
Figure 3.HGPS adipocytes exhibit characteristic cellular phenotypes(A) Immunofluorescence images of normal and HGPS adipocytes with lamin A/C staining in red and progerin staining in green at the fourth week differentiation. Nuclei are counterstained in blue with Hoechst 33342. Scale bar: 50 μm (B) Upper panel: Representative images of blebbed nucleus stained with progerin antibody and Hoechst 33342. Lower panel: Histogram shows the percentage of blebbed nuclei. (C) Upper panel: Representative images of binucleated nuclei stained with progerin antibody and Hoechst 33342. Lower panel: Histogram shows the percentage of binucleated nuclei. (D) Senescence-associated (SA)-β-Gal stainings of normal and HGPS adipocytes at the fourth week differentiation shows premature cellular senescence. Scale bar: 100 μm. Cell lines: Normal (8470) and HGPS (164).