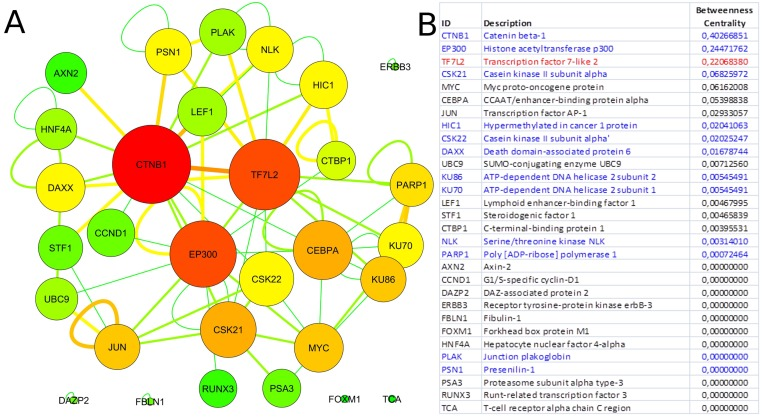
Figure 2.Tcf7l2 interactomeGraph of the Tcf7l2 interactome (A) and list of its elements (B). The most central elements in terms of betweenness centrality and node degree [85,89] are Ctnb1, Tfc7l2 (as expected) and Ep300. Non-connected nodes: TCF7L2 gene-listed gene interactions only, and no PPIs, are reported. (A) Node color code: from red to green, from highest to lowest values of betweeness centrality; interaction link color code: from red to green, from higher to lower number of experimental evidences. (B) Direct physical interactors are in blue, other types of interaction, such as colocalization and physical association are in black.