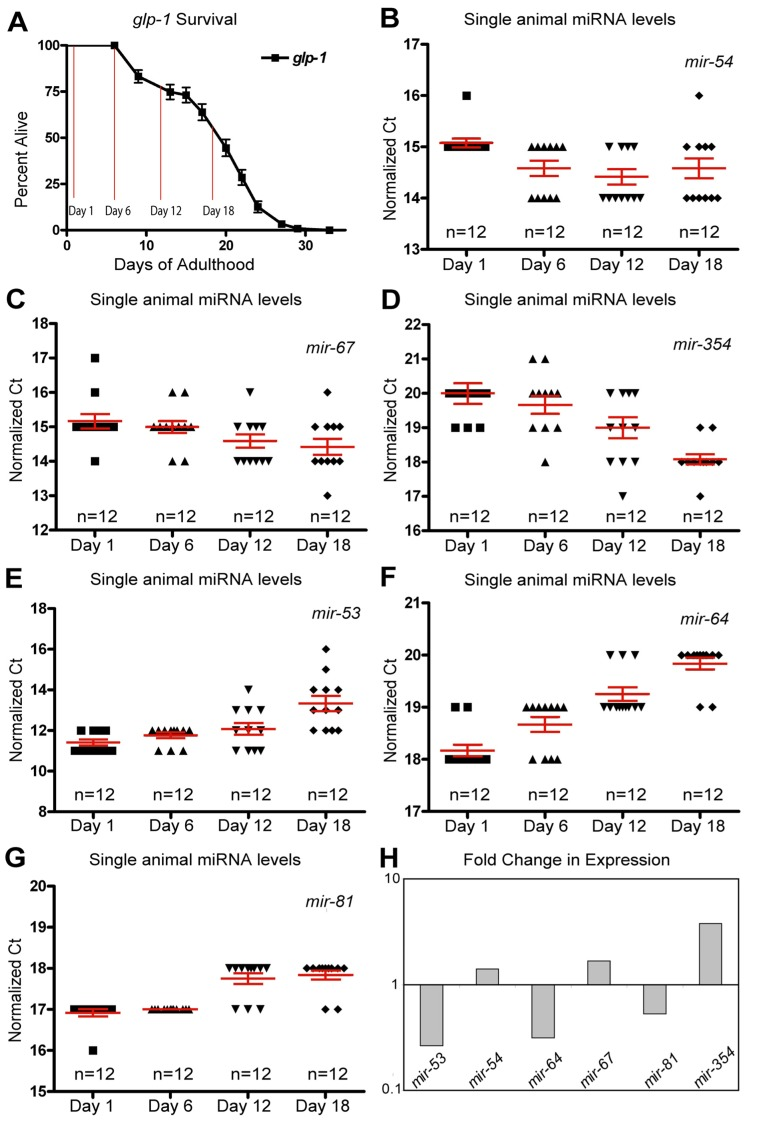
Figure 3.Dynamic changes of miRNAs with age in long-lived germline ablated animals(A) Survivorship of a population of N2 (wild type) animals, from which individuals were harvested for analysis at Day 1, Day 6, Day 12 and Day 18 of adulthood. (B-G) miRNA levels in individual worms (columns) at four time points are shown for mir-54 (B), mir-67 (C), mir-354 (D), mir-53 (E), mir-64 (F), and mir-81 (G). (H) Graphical representation of the fold change in miRNA abundance between young and old animals using averaged values. In all graphs with error bars they indicate the standard error of the mean. In individual worm graphs, each point is the average from 2-3 technical replicates.