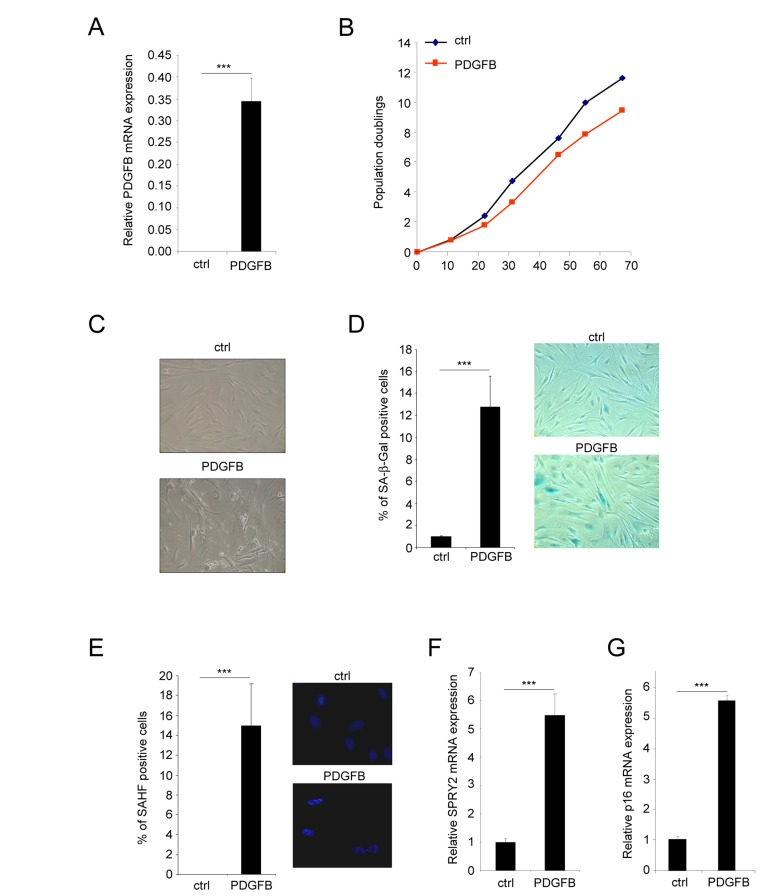
Figure 1.PDGFB induces cellular senescenceNormal human dermal fibroblasts were infected with a ctrl or PDGFB-encoding retroviral vectors. (A) RNAs were prepared and reverse-transcribed. Quantitative PCR analysis was performed using the primers described in the supplementary Table. PDGFB mRNA levels were analyzed in control cells and in PDGFB-infected cells and normalized to ACTB (Actin-β) levels. Histograms show the mean±SD of a representative experiment from three independent experiments. All experiments were performed in triplicate. (B) At the indicated time, 300.000 cells were seeded back in one 10 cm diameter dish for each condition. Population doublings were calculated according to the formula: PD=ln(number of collected cells/number of plated cells)/ln2. (C) Seventy five thousand cells from each condition were seeded in a well of 6-well plate and cultured during 7 days. Photographs were taken with a phase contrast microscope. (D) Thirty thousand ctrl or PDGFB-expressing cells were seeded in a well of a 12-well plate, and analyzed for their SA-β-Gal activity. The percentage of positive cells in each condition was calculated. A representative experiment from three independent experiments is shown. The histograms represent the mean±SD of a triplicate. To illustrate representative pictures from each condition were shown. (E) For the Senescence Associated Heterochromatin Foci (SAHF) analysis, 30.000 cells from indicated conditions were seeded in a well of a 12-well plate and fixed 2 days later with PFA 4%. Nuclei were stained by Hoechst (Sigma). Percentages of SAHF positive cells were calculated and pictures displayed. Histograms represent the mean±SD of a triplicate in a representative experiment from three independent experiments. (F-G) RNAs from the indicated cells were prepared and reverse-transcribed. Quantitative PCRs were performed against SPRY2 or p16 and the results were normalized against ACTB using primers described in the supplementary Table. Histogramms represent the mean±SD. Three different experiments were performed and one representative is shown. Statistics were performed using a t-test. *** indicated p value<0.005.