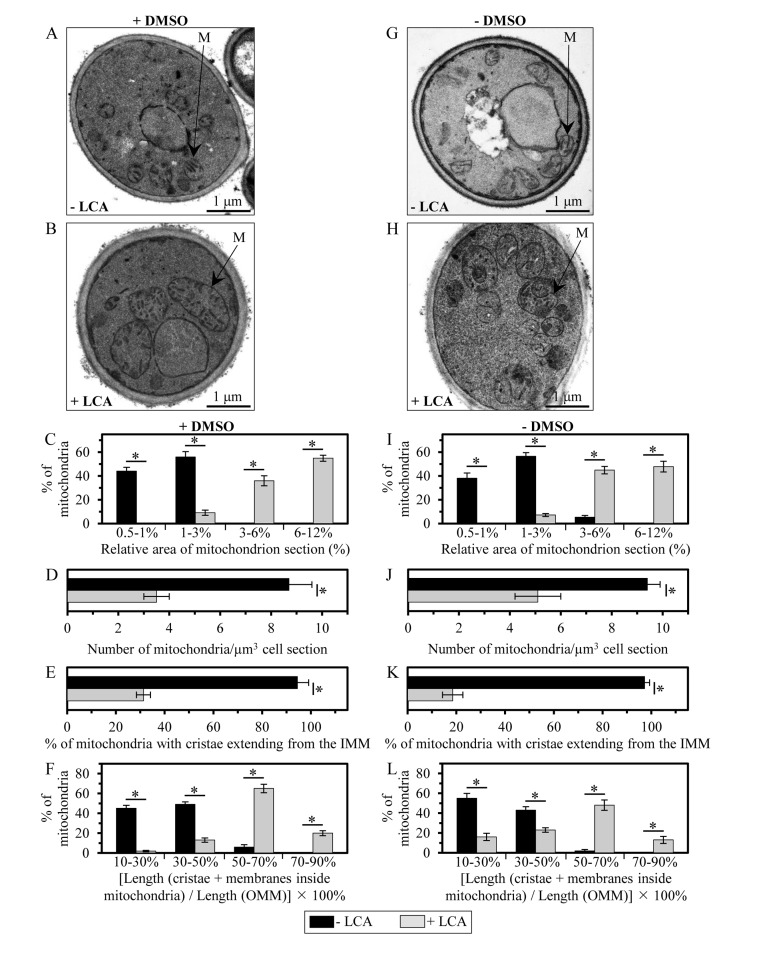
Figure 8.LCA enlarges mitochondria, reduces their number and alters their morphologyCells were cultured in the nutrient-rich YP medium initially containing 0.2% glucose with 50 μM LCA or without it, in the presence of 1% DMSO (A - F) or in its absence (G - L). (A, B, G and H) Transmission electron micrographs of yeast cells recovered on day 7 of cell culturing. M, mitochondrion. Bar, 1 μm. (C and I) Percentage of mitochondria having the indicated relative area of mitochondrion section. The relative area of mitochondrion section was calculated as (area of mitochondrion section/area of cell section) × 100%. Data are presented as means ± SEM (transmission electron micrographs of at least 100 cells were subjected to morphometric analysis for each kind of culturing conditions; *p < 0.01). (D and J) Numbers of mitochondria in yeast cells. The data of morphometric analysis are expressed as the number of mitochondria per μm3 of cell section ± SEM (transmission electron micrographs of at least 100 cells were subjected to morphometric analysis for each kind of culturing conditions; *p < 0.01). (E and K) Percentage of mitochondria that exhibit cristae extending from the IMM. Data are presented as means ± SEM (transmission electron micrographs of at least 100 cells were subjected to morphometric analysis for each kind of culturing conditions; *p < 0.01). (F and L) Percentage of mitochondria having the indicated relative length of mitochondrion cristae. The relative length of mitochondrion cristae was calculated as [the total length of mitochondrial cristae (including both cristae extending from the IMM and cristae disconnected from the inner boundary membrane)/the total length of the OMM] × 100%. Data are presented as means ± SEM (transmission electron micrographs of at least 100 cells were subjected to morphometric analysis for each kind of culturing conditions; *p < 0.01).