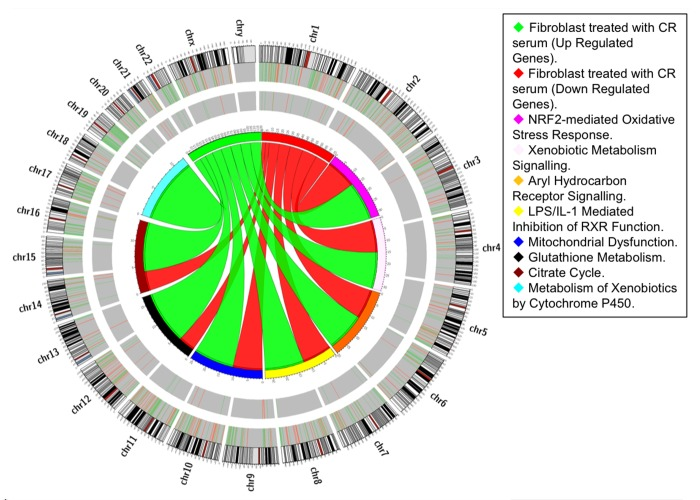
Figure 1.Pathway-based analysis. Circos diagram shows the relationship between CR differentially expressed genes and oxidative-related pathways. Ribbon ends represent links between genes and pathways while the width of the ribbon correlates with the number of genes involved. Segments in the outer ring indicate the total number of genes involved in the corresponding pathways while thin internal segments indicate the number of up-regulated (light green) and down-regulated (orange) genes.