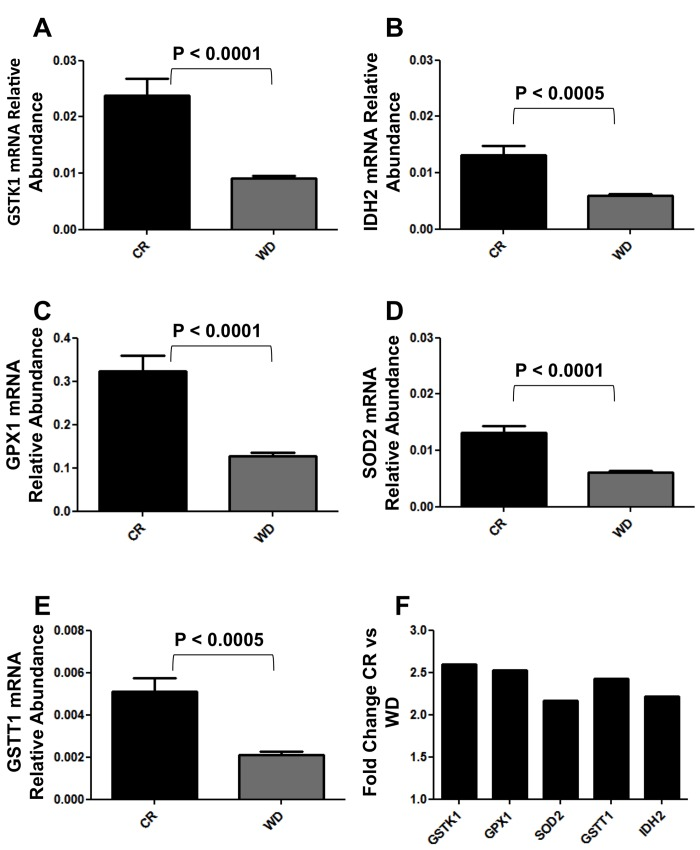
Figure 3.Real Time qPCR analysis of GSTK1, GSTT1, IDH2, GPX1 and SOD2 expression in BJ cells cultured 48hs with CR and WD sera. (A-E) Data are expressed as the gene of interest abundance relative to the GAPDH (Mean ± SEM); n = 12 CR, n = 13 WD. Student's t test was used to determine P-values. (F) Data are expressed as fold changes relative to CR cultures.