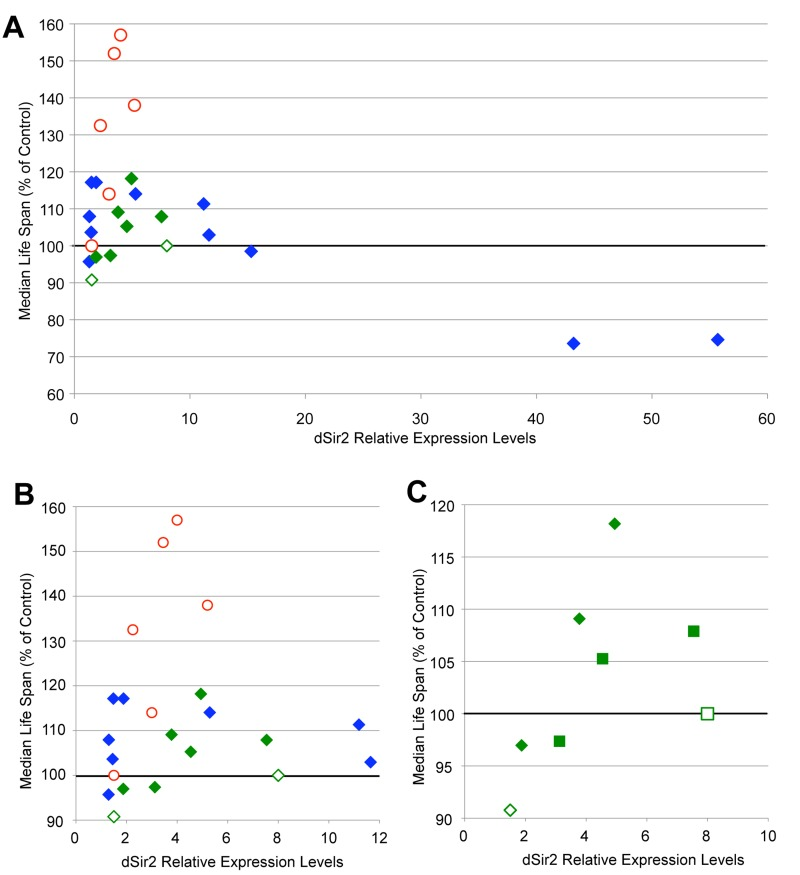
Figure 2.Increased dSir2 expression extends life span dose-dependently(A) Median life span change (shown as % of control) is plotted as a function of dSir2 expression levels for life span experiments described in this study and in previous reports. (B) A finer view of x-axis dSir2 levels below 12-fold is shown. For all figures, previously published life spans are shown as open data points [5,6,7,10]. For figures A and B, life spans using dSir2EP2300 are shown as red circles and UAS-dSir2 transgene life spans are shown as diamonds. Life spans using the UAS-Sir2-myc lines from [10] are shown in green, while life spans conducted using UAS-Sir2-1, Sir2-3, or Sir2-4 lines in this study are shown in blue. (C) dSir2 expression levels and median life span extension from [10] (diamonds = Myc2, squares = Myc9, open data points indicate data from [10]) and from our studies using the Tubulin-Gene Switch driver and three levels of RU-486 (100 μM, 200 μM, and 500 μM) (green diamond = Tubulin-Gene Switch>Myc2, green square = Tubulin-Gene Switch>Myc9). In life span experiments published in [5], additional EP lines that over-express dSir2 from the endogenous locus also extended life span, but are not included in this graph because of the lack of data on their level of dSir2 expression. Life span statistics can be found in table S1, and qPCR p-values in table S2.