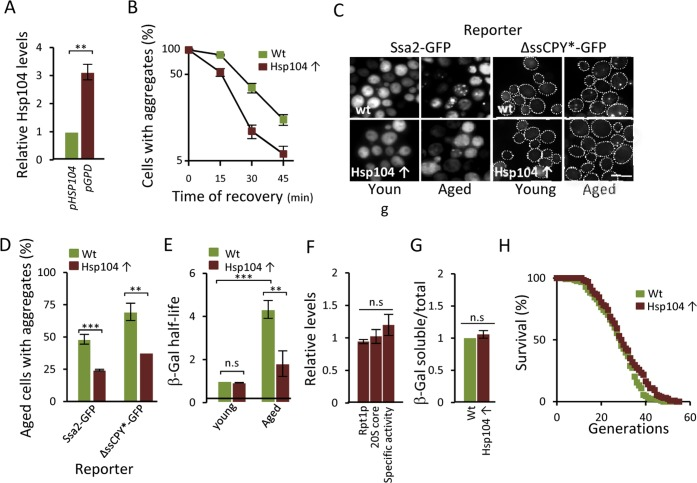
Figure 5.Overproducing Hsp104 mitigates aggregate accumulation and restores proteasome function in aged cells.(A) Relative levels of Hsp104 produced from the wt HSP104 and GPD promoters as determined by anti-Hsp104 immuno-blot analysis (n=2). (B) Percentage of cells with Ssa2-GFP foci following heat stress in the wt and Hsp104 overproducing (Hsp104↑) strains. Time point “0” represents cells after 30 min incubation at 42°C, whereas subsequent time points represent cells following the indicated time of recovery at 30°C (n=2). (C) The effect of Hsp104 overproduction on aggregate formation. Representative image of Ssa2-GFP and ΔssCPY*-GFP in young and aged, wt and Hsp104 overproducing cells. (D) Percentage of aged wt and Hsp104 overproduction cells with Ssa2-GFP or ΔssCPY*-GFP foci (n=2). (E) Relative half-life of β-gal in wt and Hsp104 overproducing young and aged cells. Values were normalized to the half-life in wt young cells (n=3). (F) Relative levels of Rpt1p (19S subunit), 20S core proteins, and proteasome specific activity (rate of hydrolysis of suc-LLVY-AMC) in Hsp104 overproducing cells compared to wt cells. (n≥2). (G) Relative levels of soluble β-gal in wt and Hsp104 overproducing cells normalized to total protein (see Experimental procedures for details) (n=2). Error bars represent standard deviation. For statistical analysis, the paired two-tailed t-test was used where *P<0.05, **P<0.01, ***P<0.001 and n.s = no significant difference. (Scale-bar represents 10μM). (H) Life-span curves of wt and Hsp104 overproducing cells. Mean replicative life-spans are: wt (28 ± 0), Hsp104 overproduction (29.5 ± 1.5) (n=2). (n= sets of analysis).