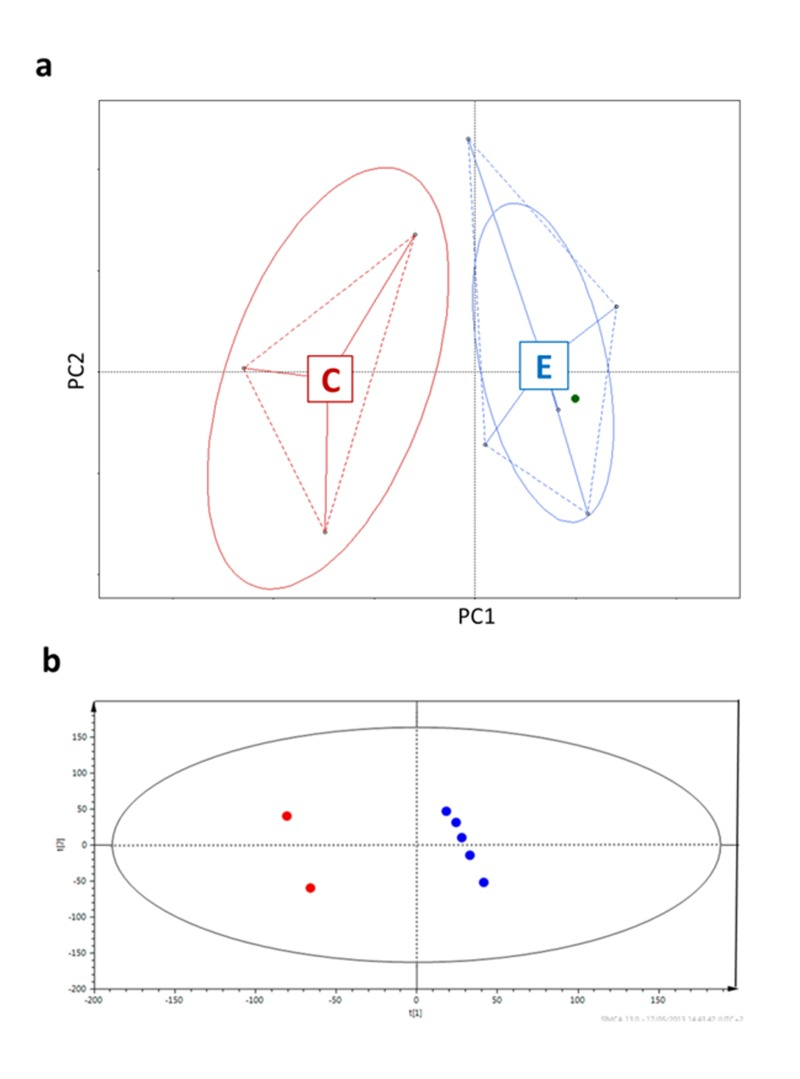
Figure 1.Centenarians and elderly differ in both microbiota composition (a) and urine metabotypes (b)a, Principal coordinates analysis (PCoa) of Euclidean distances between HITChip profiles [8]. PC1 represents 36.46% of the variability, PC2 19.91%. b, Two centenarian subjects versus elderly group; R2 = 0.394, Q2 = 0.596, two-component model. The ellipses represent the Hotelling's T2 with 95% confidence. Subjects are colored according to the age groups: red for centenarians, blue for elderly people, green for the young adult.