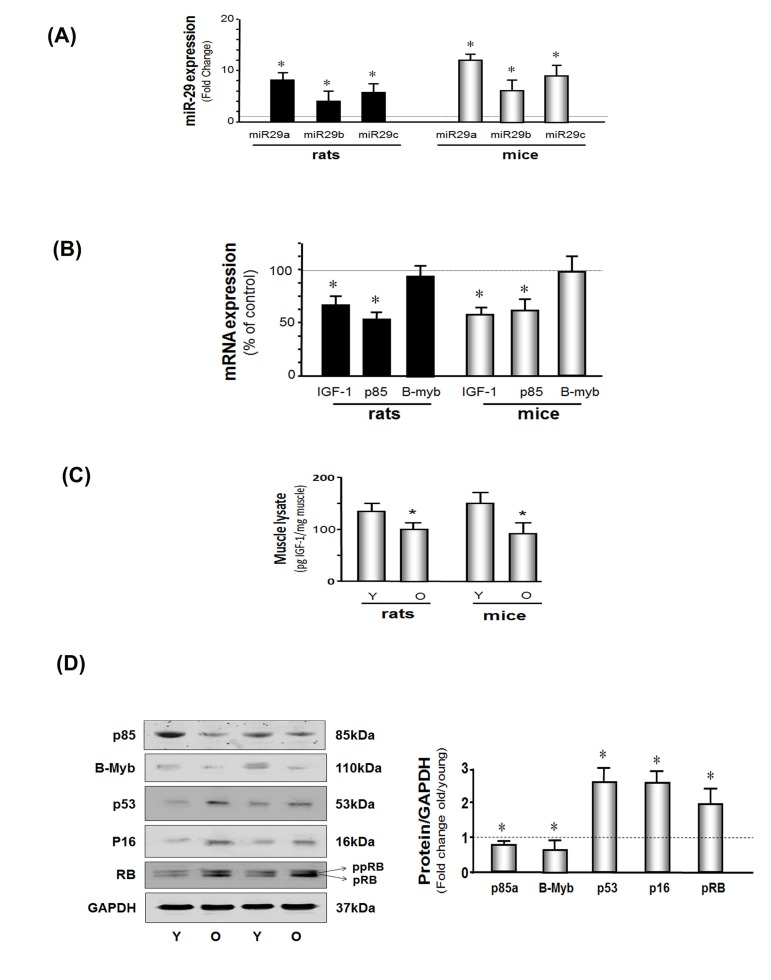
Figure 1.miR-29 and cellular arrest proteins are increased and IGF-1, p85 and B-myb are decreased in the muscles of aged rodents(A) Total RNA obtained from hind-limb muscles of young and aged rats and mice were assayed for miR-29a, b and c by real time qPCR. The bar graph shows miR-29a, b and c in aged rodents muscles expressed as a fold change above the control (young rodent) which is represented by a line at 1-fold. Results are normalized to U6 RNA (Bars: mean ± s.e.; n=6 pairs; *p<0.05 vs. young). (B) Total RNA from hind-limb muscles of young and aged rats and mice were assayed for IGF-1, p85 and B-myb expression by real time qPCR. The bar graph shows IGF-1, p85 and B-myb in aged rodents muscles expressed as a percentage of control (young rodent) which is represented by a line at 100%. Results are normalized to 18S RNA (Bars: mean ± s.e.; n=6 pairs; *p<0.05 vs. young). (C) IGF-1 protein level was measured by ELISA in muscle lysates from young and old rodents. Results in the bar graph compare the amount of IGF-1 in muscle from old (O) vs. young (Y) rats and mice. All data were normalized to the muscle total protein concentration (Bars: mean ± s.e.; n=6; *p<0.05 vs. young). (D) p85α B-myb, p53, p16INK4A, RB and GAPDH proteins were measured by western blotting of muscle lysates from young and old mice. Two bands of the RB protein were detected: the lower band is hypophosphoryated RB (pRB; MW 107 kDa) while the upper band is more highly phosphorylated RB protein (ppRB; MW 112kDa). Results in the bar graph compare the densities of protein bands in aged muscle expressed as a fold-change from levels in young mice which is represented by a line at 1-fold. All band densities were normalized to the density of GAPDH (Bars: mean ± s.e.; n=6; *p<0.05 vs. young).