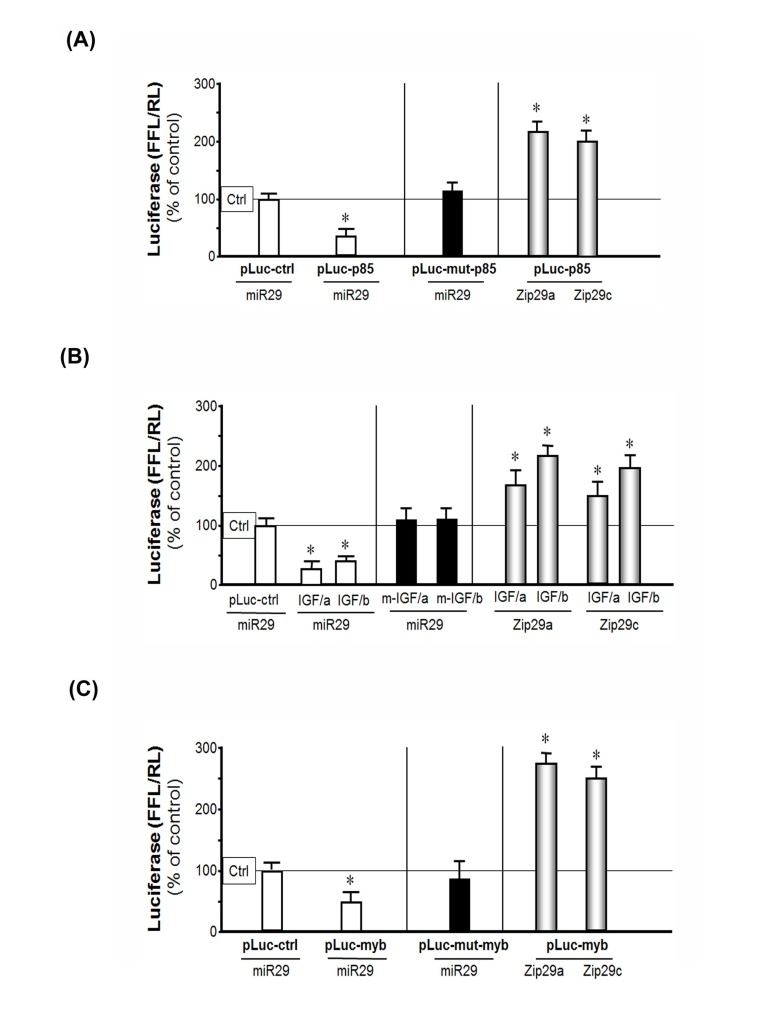
Figure 4.miR-29 binds to the 3'-UTR of p85α, IGF-1 and B-myb in MPCs suppressing their translation (luciferase activity)(A) MPCs were transfected with pLuc-ctrl, pLuc-p85α-3'-UTR or pLuc-mutant-p85α (p85α with a mutated 3'-UTR binding site for miR-29). Then they were treated with the empty virus (Ctrl), the miR-29 adenovirus to over-express miR-29 (miR-29) or miR-29 inhibitor (Zip29a or Zip29c). Luciferase activity in cells that received the control virus was designated as the 100% activity level (designated by a horizontal line in the graph). The other bars all show the response of the cells to miR-29 or zip-miR-29 (indicated below each bar) expressed as a percent of the control level for each experiment. Left (white bars): the effect of miR-29 on p85α 3'-UTR; middle (black bar): the effect of miR-29 on mutated p85α 3'-UTR; right (gray bars): the effect of inhibited endogenous miR-29 on p85α 3'-UTR. Triplicate determinations were made in each condition and each experiment was repeated a total of three times; the results were combined to calculate differences in firefly luciferase activity normalized by renilla luciferase activity. The data represent mean ± s.e.; (n=9; *p<0.05 vs. Ad-ctrl).(B) MPCs were transfected with constructs containing the two miR-29 binding sites on IGF-1 3'-UTR, pMIR-IGF/321-3217 (IGF/a) and pMIR-IGF/3275-5574 (IGF/b), before being treated with the empty adenovirus (Ctrl), Ad-miR-29 (miR29) or miR-29 inhibitor (Zip29a or Zip29c). Luciferase activity in cells that received the control virus was designated as the 100% activity level (designated by a horizontal line in the graph). The other bars all show the response of the cells to miR-29 or zip-miR-29 (indicated below each bar) expressed as a percent of the control level for each experiment. Left (white bars): the effect of miR-29 on the two IGF 3'-UTR binding sites (IGF/a or IGF/b); middle (black bars): the effect of miR-29 on mutated (m-) IGF/a or IGF/b; right (gray bars): inhibited endogenous miR-29 effect on IGF/a or IGF/b. The results were combined to calculate differences in firefly luciferase activity normalized by renilla luciferase activity. The data represent mean ± s.e.; (n=9; *p<0.05 vs. Ad-ctrl). (C) MPCs were transfected with pLuc-ctrl, pLuc-3'UTR-B-myb (pLuc-myb) or pLuc-mutant-B-myb (pLuc-mut-myb). Then they were treated with the empty virus (ctrl), the miR-29 adenovirus (miR29) to over-express miR-29 or miR-29 inhibitor (Zip29a or Zip29c). Luciferase activity in cells that received the control virus was designated as the 100% activity level (designated by a horizontal line in the graph). The other bars all show the response of the cells to miR-29 or miR-29 inhibitor (Zip29a or Zip29c) expressed as a percent of the control level for each experiment. Left (white bars): the effect of miR-29 on B-myb 3'-UTR; middle (black bar): the effect of miR-29 on mutated B-myb 3'-UTR; right (gray bars): inhibited miR-29 effect on B-myb 3'-UTR. The results were combined to calculate differences in firefly luciferase activity normalized by renilla luciferase activity. The data represent mean ± s.e.; (n=9; *p<0.05 vs. Ad-ctrl).