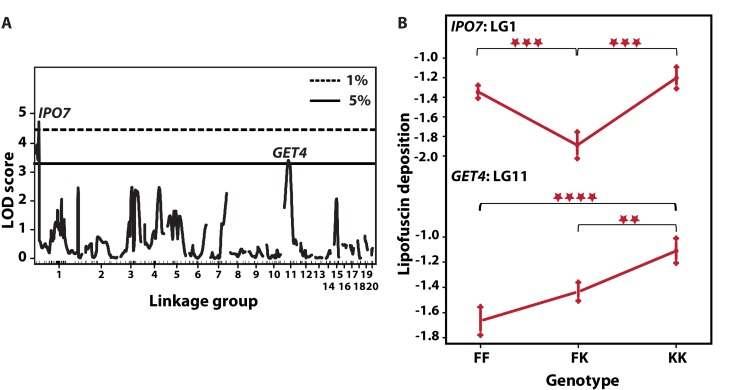
Figure 5.QTL for LFD and their allelic effects(A) Single-QTL genome-wide scan. LOD scores (y-axis) are plotted against genetic distance (cM, x-axis). Horizontal lines depict data-derived significant LOD score thresholds (permutation test): dotted line, P < 0.01 and solid line P < 0.05. Two significant peaks appear on LG1 at marker IPO7 with LOD 4.40 and LG11 at GET4, LOD 3.44. Linkage groups are shown on the x-axis and markers depicted with inner tick marks. (B) Plot of estimated phenotype averages at markers IPO7 and GET4. The y-axis indicates phenotype values on logarithmic scale. The x-axis depicts the three genotypes at each marker – FF refers to F2 homozygous for N. furzeri GRZ allele, FK stands for heterozygous F2 and KK for F2 homozygous for the N. kadleci allele. Bars at each genotype are standard error of mean. Significant differences in phenotype mean between genotypes are shown by asterisks (**) =P<0.01, (***) = P<0.001, (****) = P<0.0001.