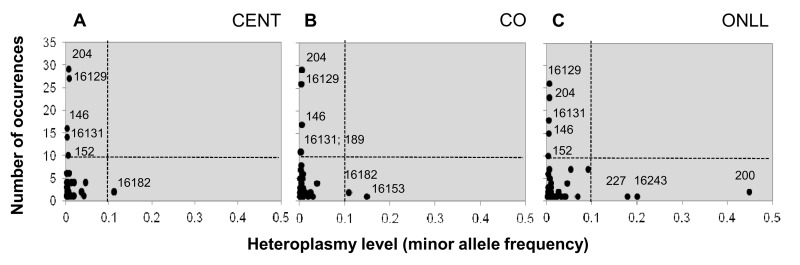
Figure 2.Heteroplasmic positions in the 3 groupsHeteroplasmic positions plotted according to mean heteroplasmy level and number of occurrences in CENT (A), CO (B) and ONLL (C) respectively.
Figure 2 — Transmission from centenarians to their offspring of mtDNA heteroplasmy revealed by ultra-deep sequencing | Aging