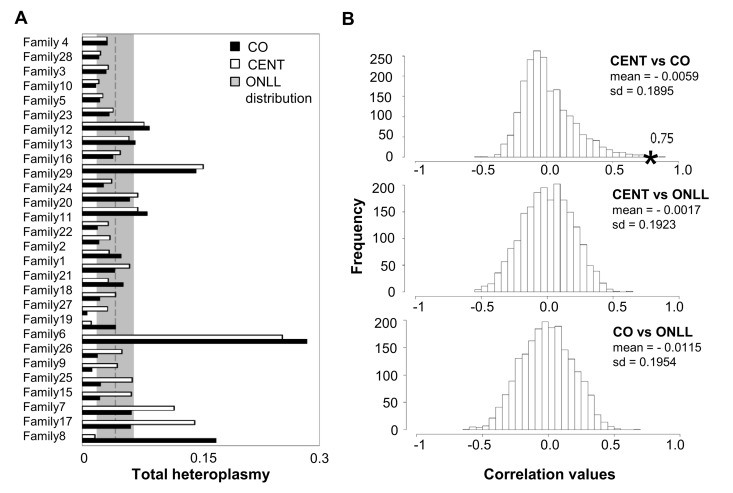
Figure 3.Total heteroplasmy in centenarians and their offspring and reshuffling analysis(A) Total heteroplasmy in centenarians and their offspring. White bars: centenarians; black bars: matched offspring. The dashed line and shading show the mean level and standard deviation of total heteroplasmy in ONLL. (B) Frequency distribution of correlation values based on 2000 reshufflings of total heteroplasmy values for CENT and unrelated CO, CENT and ONLL and CO and ONLL. Mean and standard deviation of the distribution is reported. The black star indicates the observed correlation value matching each centenarian with her own offspring.