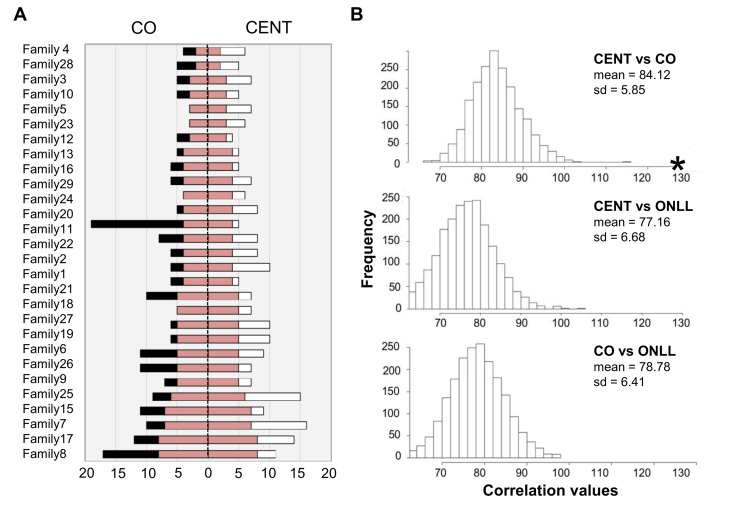
Figure 4.The number of common heteroplasmic sites shared by CENT and CO and frequency distributions of TNCS in all the reshuffled pairs(A) The white bar indicates the number of heteroplasmic position in CENT, the black bar indicates the number of heteroplasmic sites in CO. CENT and CO are here matched according to consanguinity (x-axis). The red bar shows the number of shared heteroplasmic sites in each parent-offspring pair. (B) Frequency distributions of TNCS in all the reshuffled pairs considering CENT and unrelated CO, CENT and ONLL, and CO and ONLL. Black star = total number of common heteroplasmic sites matching centenarians with their own offspring.