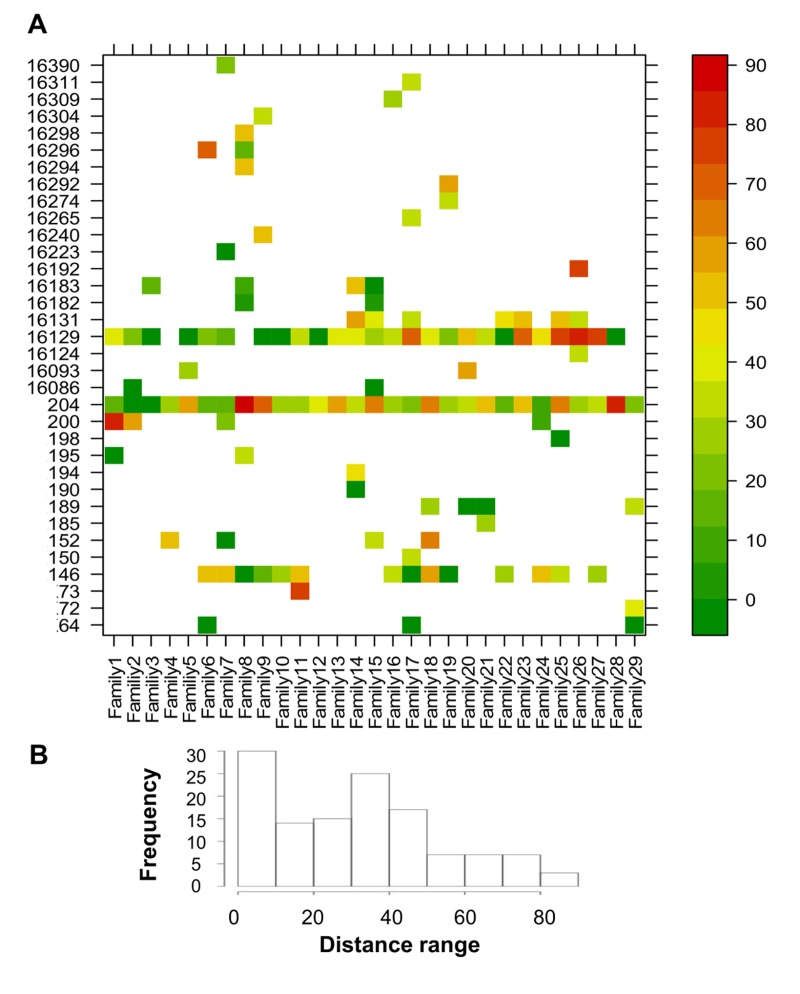
Figure 5.CENT and CO distances of positions that showed heteroplasmy in both individualsDistance values were calculated as the ratio between the absolute difference between CENT and CO MAF and the higher MAF value of the two (expressed as percentage). (A) Heteroplasmy distances plotted for each position and colored according to the scale bar on the right. (B) Frequency distribution of the distance values.