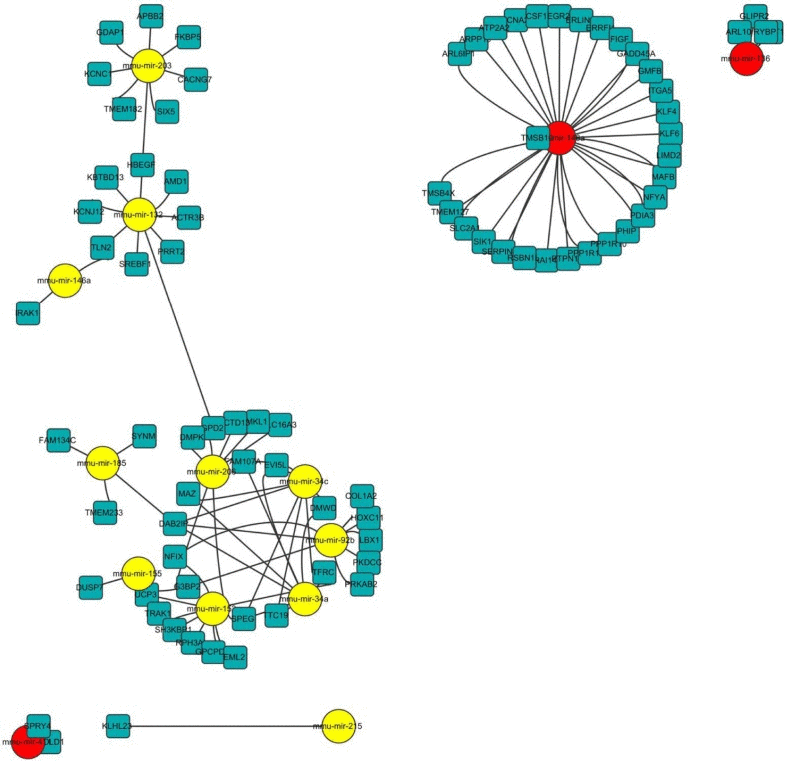
Figure 5.Network of miRNA-mRNA interactionThe network displays the predicted interactions between age-related miRNAs and mRNAs from the sequencing and was generated using Cytoscape (version 3.0, www.cytoscape.org/). The up-regulated miRNAs are shown in yellow, down-regulated miRNAs in red. The miRNAs are depicted by circles and the mRNAs as squares. Their interaction is represented by one edge.