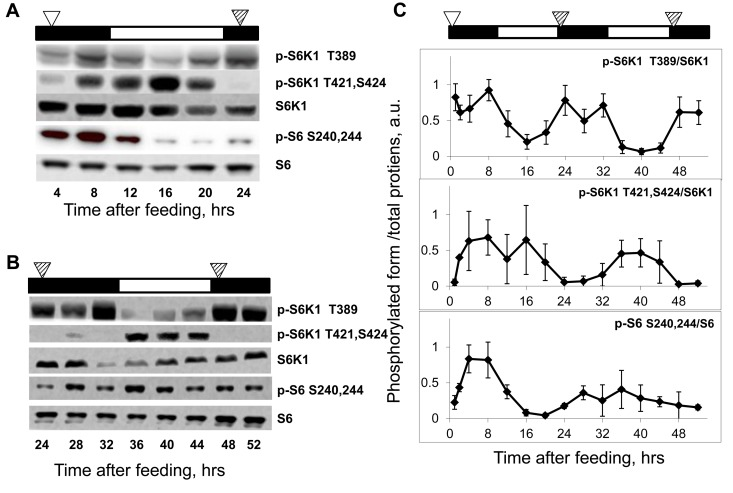
Figure 2.Daily rhythms in mTORC1 signaling are feeding-independent. Bars on the top of each figure represent the light (open bars) and the dark (black bars) parts of the day. (A and B) Representative western blots (WB) of daily rhythms in phosphorylation of mTORC1 downstream targets in the liver of TR fed mice. Food was provided at time point 0, and animals did not receive any more food throughout the experiment. (A) Animals have been sacrificed 4-24 hrs after the last feeding. (B) Animals have been sacrificed 24-52 hrs after the last feeding. The white arrowhead indicates the time of the last feeding; the striped arrowheads indicate the time of expected feeding (animals would expect the food, but the food was not provided). (C) Quantification of phosphorylation of S6K1 and ribosomal S6 proteins at indicated sites normalized to total levels of the indicated proteins in the liver of mice entrained by TR feeding. 3 male mice per each time point and feeding regimen have been used. Data present Average +/− SEM; * p<0.05, statistically significant difference between different treatments.