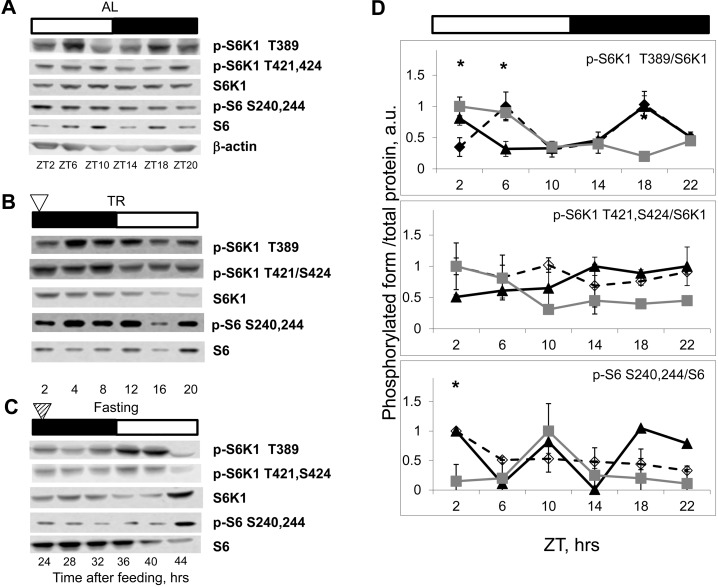
Figure 3.NAMO-controlled rhythms in mTORC1 activity are present in the spleen. Bars on the top of the figure represent the light (open bars) and the dark (black bars) parts of the day. ZT0 is the time when light is turned on. (A, B and C) Representative Western blots (WB) of daily rhythms in phosphorylation of mTORC1 downstream targets in the spleen: (A) of ad libidum (AL) fed mice; (B) of time restricted (TR) fed mice; (C) of fasted (F) mice (animals were entrained to TR feeding, 100% of daily food intake was provided as a single meal at the time point 0 (ZT14), but no food was provided for the last period (24-44h)). The white arrowhead indicates the time of feeding; the striped arrowhead indicates the time of expected feeding. (D) Quantification of phosphorylation of S6K1 and ribosomal S6 proteins on indicated sites normalized to total levels of the indicated proteins in the spleen of AL (open diamonds, dashed black line), TR (black triangles, solid black line) and F (gray squares, gray line) mice. 3 male mice per each time point and feeding regimen have been used. Data present Average +/− SEM; * p<0.05, statistically significant difference between different treatments.