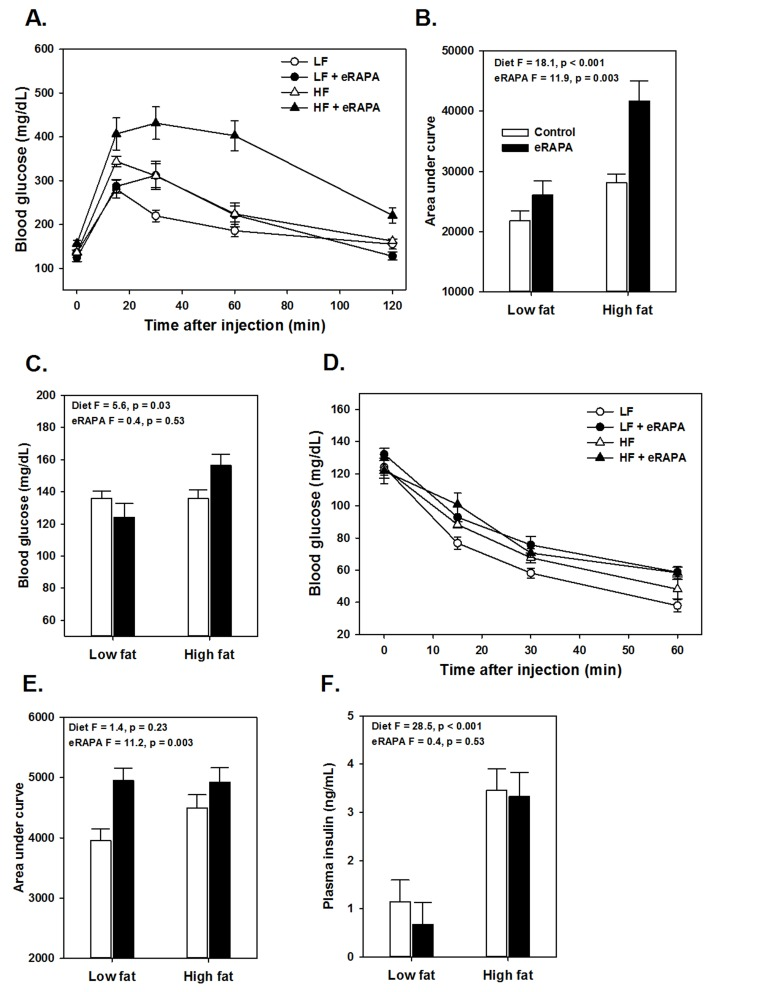
Figure 3.(A) Glucose tolerance tests for UT-HET3 males fed indicated diets for 3 months. (B) Area under curve (AUC) calculations for glucose tolerance tests shown in A. (C) Fasting blood glucose levels for mice in A. (D) Insulin tolerance tests for UT-HET3 males fed indicated diets for 3 months. (E) AUC for insulin tolerance tests for insulin tolerance tests. (F) Fasted plasma insulin levels. For all, symbols represent average (± SEM) values for n=6-10 mice at indicated time point for mice fed low fat (circle) or high fat (triangle) diets with (solid) or without (open) encapsulated rapamycin (eRAPA). F and p values are given for 2 way ANOVA testing indicated variables.