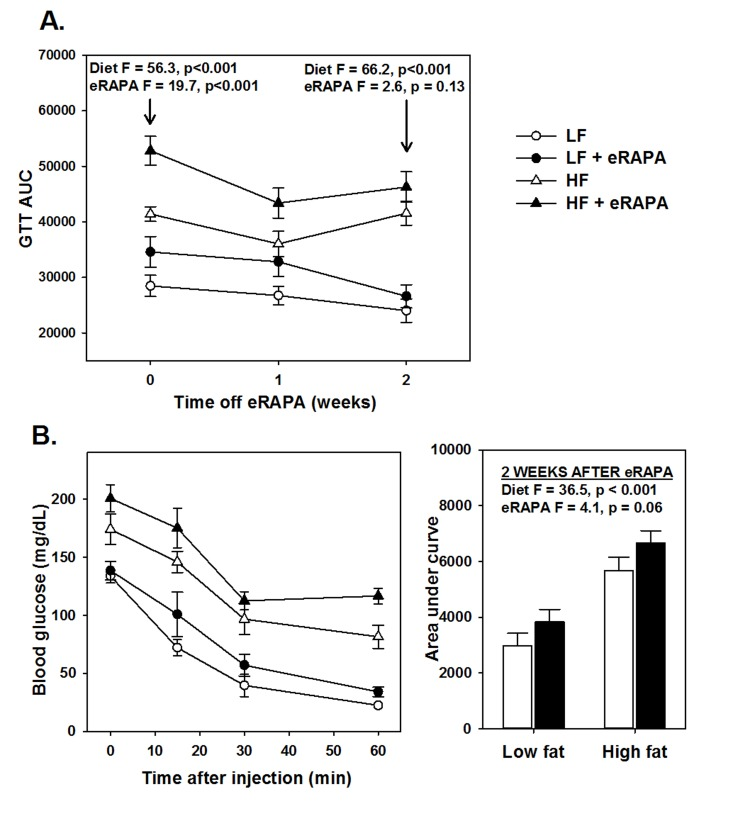
Figure 5.(A) Area under curve (AUC) calculations for glucose tolerance tests following 0, 1 and 2 weeks after cessation of encapsulated rapamycin (eRAPA) treatment. (B) Insulin tolerance tests (left) and AUC calculations (right) in mice 2 weeks after cessation of eRAPA treatment. For both, symbols represent average (± SEM) values for n=6 mice treated with (solid) or without (open) eRAPA for the indicated diet. F and p values are given for either 2 way ANOVA testing indicated variables.