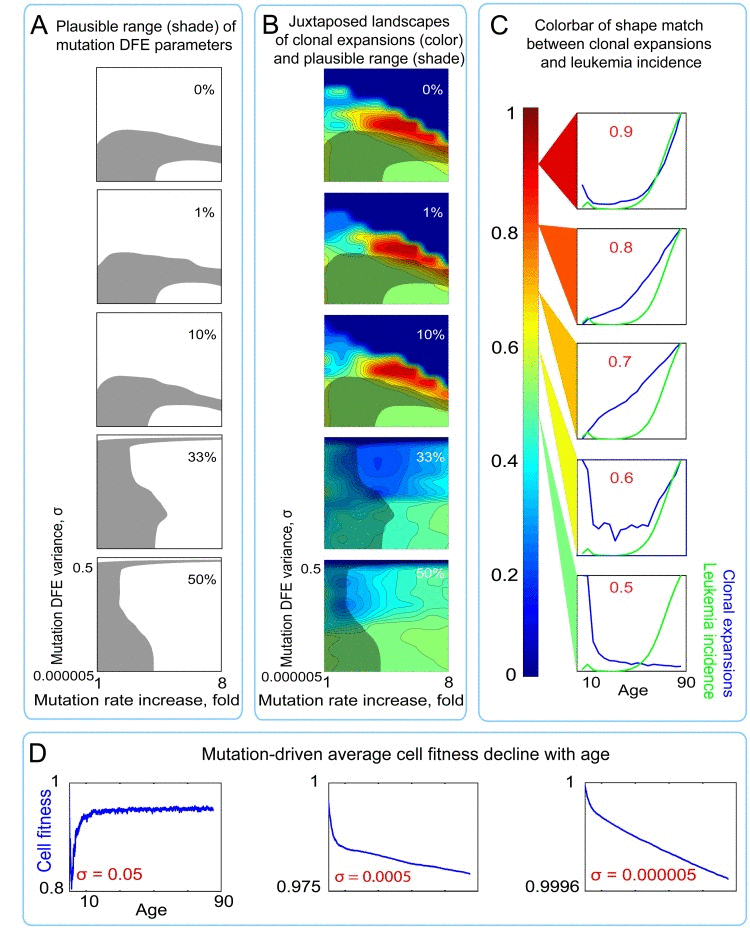
Figure 5.Landscapes of clonal expansions in the simulated pools under different parameters of mutation DFE when cell fitness is defined by mutations only(A) Shaded regions represent the plausible range of mutation DFE variance and rate increase over lifetime (for derivation see Fig. 4) under different proportions of mutations in the positive tail of the DFE. (B) Plots of shape match landscapes within the studied ranges of mutation DFE variance (σ; Y-axis) and mutation rate increase (X-axis). Colored landscapes represent age-dependent rates of somatic evolution as shown in the panel C. The proportion of mutation DFE variance in the positive tail is indicated in white text. Plausible ranges of mutation parameters from panel A are compared to mutation parameters that replicate exponentially increasing rates of somatic evolution that shape-match the leukemia incidence curve. (C) Color scale for panel B; colors represent the goodness of shape match between age-dependent leukemia incidence (green line) and simulated clonal expansions (blue line depicts the share of the most successful clone at any given time). (D) Age-dependent average cell fitness decline in the simulated pool for the indicated values of mutation DFE (σ).
Figure 5 — Stochastic modeling indicates that aging and somatic evolution in the hematopoietic system are driven by non-cell-autonomous processes | Aging