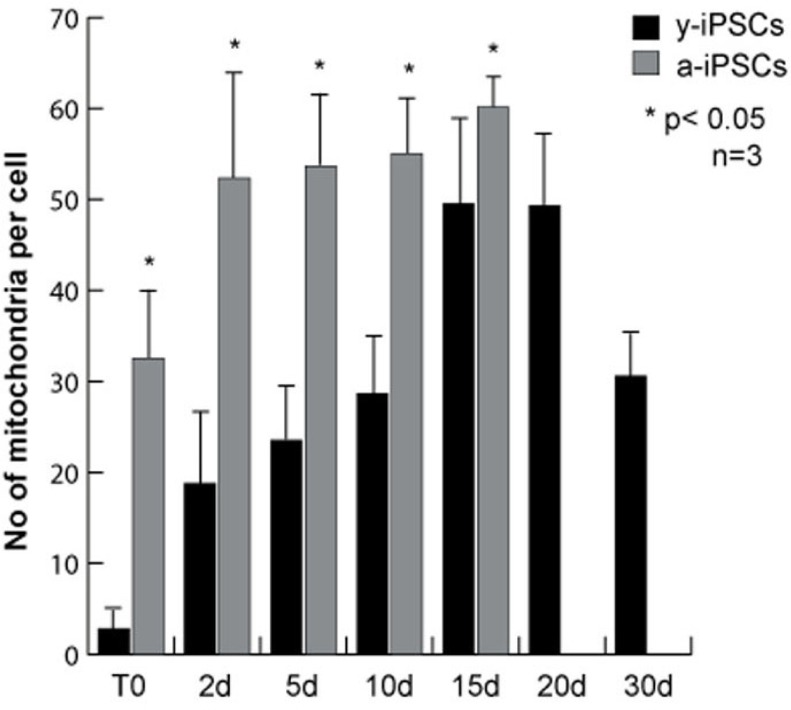
Figure 3.Quantitative analysis of the number of mitochondria in y- and a-iPSCs before and during neuronal differentiationThe bar graph represents the average number of mitochondria per cell and was obtained counting the mitochondria from immunofluorescence assays using the mitochondria specific antibody. The data were obtained from three independent experiments. Data are represented as mean ± SD.