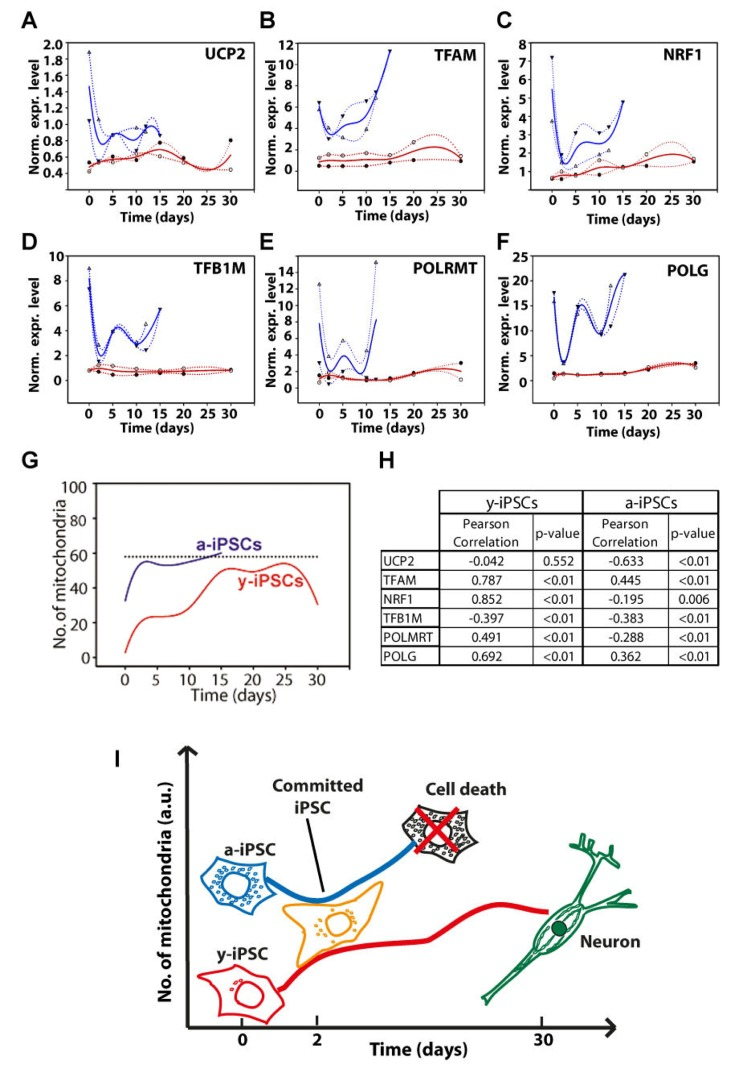
Figure 4.Gene expression analysis of genes relevant to mitochondrial biogenesis and schematic drawing depicting the differences between young- and aged-iPSCs during neuronal differentiation in relation to mitochondrial number and cell death(A-F) Normalized expression levels of UCP2 (A), TFAM (B), NRF1 (C), TFB1M (D), POLMRT (E) and POLG (F) genes. Red and blue lines indicate the expression behavior of y- and a-iPSCs, respectively, during differentiation. (G) The number of mitochondria, obtained by immunofluorescence, has been displayed for y- and a-iPSCs (red and blue lines, respectively). Dotted line indicates an arbitrary number of mitochondria. (H) Correlation between the number of mitochondria and gene expression levels has been calculated and reported in the table together with Pearson's correlation coefficients and statistical significance (p-value). (I) Scheme illustrating y- and a-iPSCs in relation to their number of mitochondria (on the y axis) before and during in vitro neurogenesis (with the time reported on the x axis). The black cell depicted, which represents a-iPSCs during neuronal differentiation, is full of mitochondria and encounters cell death.