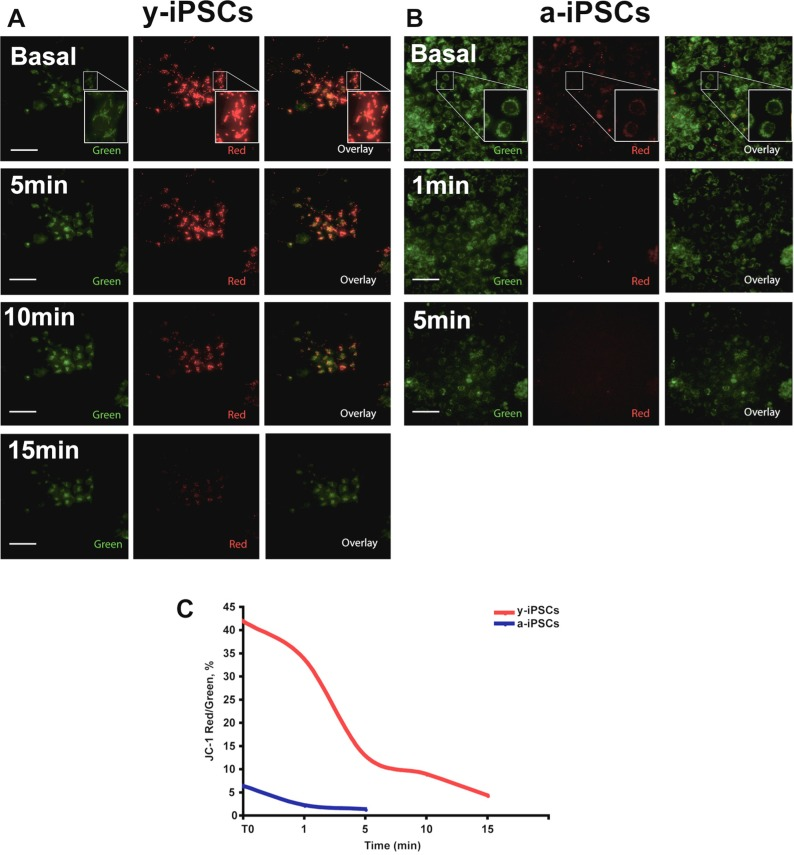
Figure 7.y- and a-iPSCs present differences in basal MMP and following H2O2 exposure(A) JC-1 staining images before and after 5, 10 and 15 minutes after H2O2 exposure in y-iPSCs. (B) JC-1 staining images before and after 1 and 5 minutes after H2O2 exposure in a-iPSCs. Regions of high mitochondrial polarization are revealed by red fluorescence due to J-aggregate formation of the concentrated dye, whereas depolarized regions are indicated by green fluorescence of JC-1 monomers. Pictures are representative images chosen among 3 independent experiments performed in live imaging condition where CO2 (5%) and Temperature (37°C) were controlled using a top stage incubator. Magnified views of the boxed area are displayed as Insets in A and B. Scale bar: 75 μm. (C) Time course of y- and a-iPSCs before and during H2O2 treatment showing the fluorescence intensity ratio (expressed as %) for JC-1 staining (Red/Green fluorescence intensity ratio).