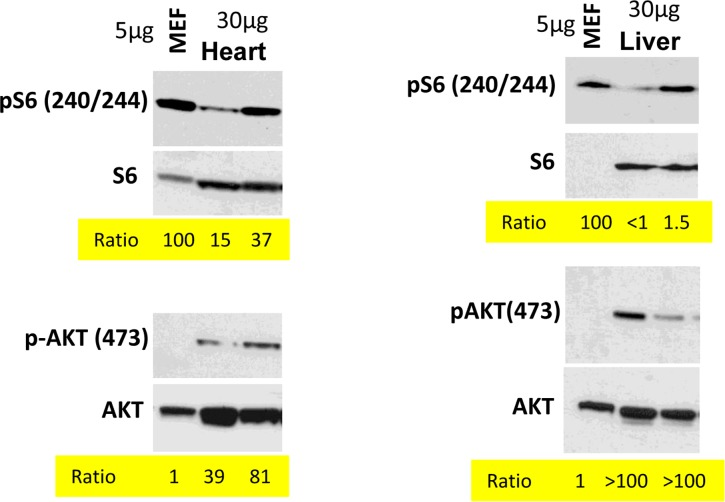
Figure 4.Comparison of p-S6(S240/244) and pAKT(S473) levels in murine heart and liver vs cultured MEFsImmunoblot analysis. 5 μg protein MEF lysate and 30 μg protein mice tissue were separated on the same gel and blotted for pS6/S6 and pAKT(S473)/AKT. Signal intensities were quantified using ImageJ program and normalized levels of p-S6 and p-AKT in mice organs were estimated. Ratio in MEFs is 100 and 1 (indicated as numbers). Methods are described previously and corresponding tissues samples blots published [103, 138-140].