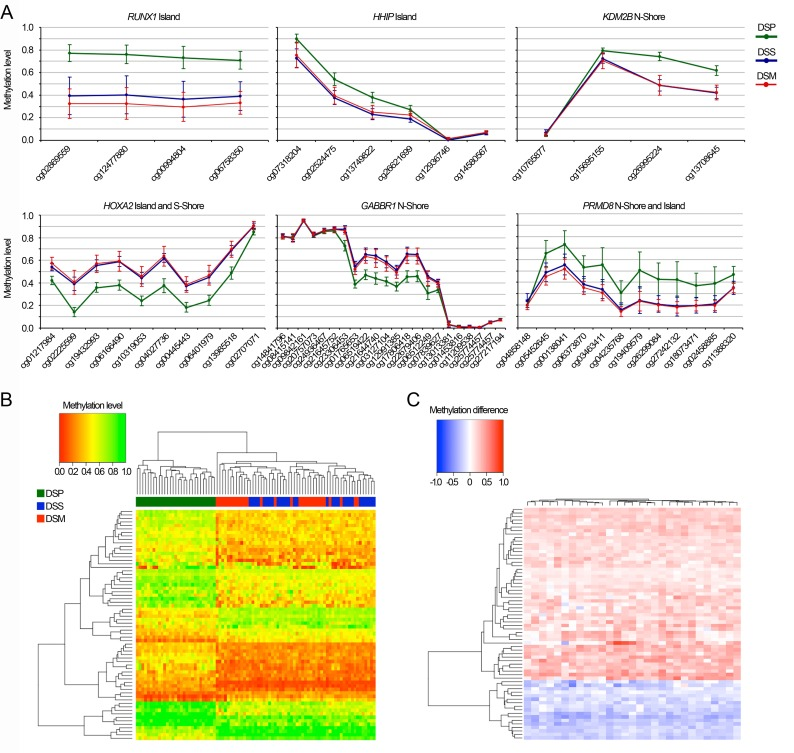
Figure 3.Epigenetic signature of Down Syndrome(A) DNA methylation profiles of 6 of the 68 BOPs included in the epigenetic signature of DS. (B) The heatmap reports DNA methylation values for the 68 BOPs included in the epigenetic signature of DS (CpG probes in rows, samples in columns and color-coded). Dendrograms depicts hierarchical clustering of probes and samples. (C) For the 68 BOPs included in the epigenetic signature of DS, the heatmap reports DNA methylation differences between each DSP and his/her DSS (CpG probes in rows, samples in columns). Dendrograms depicts hierarchical clustering of probes and samples (DSP-DSS pairs). Both in (B) and in (C) the methylation value of the most significant CpG probe within each BOP was considered.