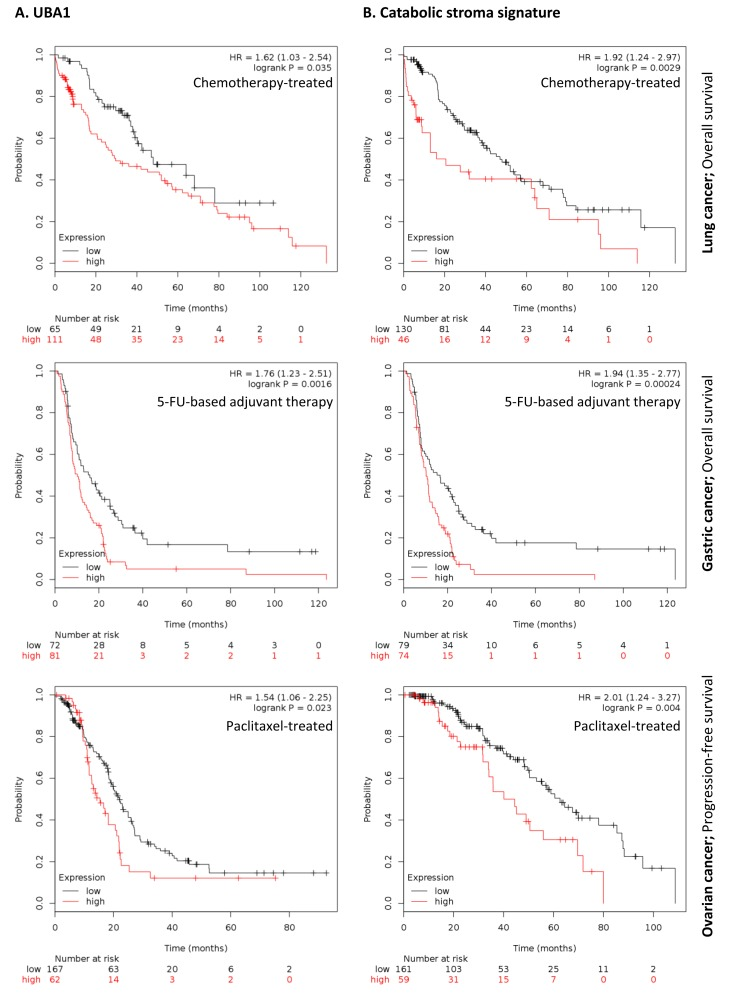
Figure 8.Clinical correlations of UBA1 expression and the UBA1, PSMC5, IGF2R, VAT1, HMOX1, CNN2, TLN1, GNPDA1, G6PD and FASN signature in chemotherapy-treated lung, gastric and ovarian cancer patients(A) Correlations of UBA1 expression with overall survival in lung and gastric cancer, and with progression-free survival in ovarian cancer. (B) Correlations of the catabolic stroma signature with overall survival in lung and gastric cancer, and with progression-free survival in ovarian cancer. All graphs are calculated using microarray data from 176 chemotherapy-treated lung cancers, 153 5-FU-based adjuvant therapy-treated gastric cancers, and 229 paclitaxel-treated ovarian cancers, determined using an online survival analysis tool. Kaplan-Meier correlations are plotted for high (above median, in red) and low (below median, in black) gene expression.