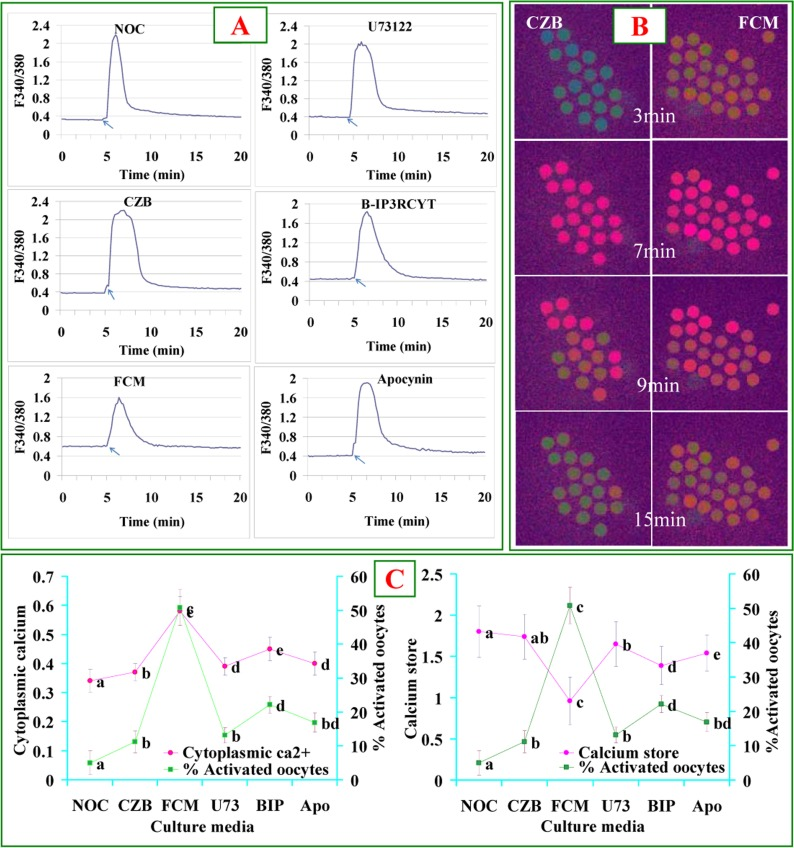
Figure 2.Levels of cytoplasmic calcium and calcium stores after oocytes were cultured for 9 h in different media. Panel A contains 6 graphs showing cytoplasmic calcium profiles in newly ovulated control (NOC) oocytes, and oocytes aged in CZB or FCM with U73122 (U73), B-IP3RCYT (BIP) or Apocynin (Apo), respectively. The arrows in graphs of Panel A indicate the time for ionomycin addition. Panel B contains Fura-2 images at different times of calcium measurement showing pseudo-colored F340/380 ratio after oocytes were cultured for 9 h in CZB or FCM. While the green color represents a low ratio, the red represents a high ratio of F340/380. Panel C consists of two graphs showing the correlation between oocyte ethanol activation rates and cytoplasmic calcium or calcium store, respectively, in oocytes aged in different media. To quantify calcium profiles, each treatment was repeated 3 times with each replicate containing about 20 oocytes. a-e: Values without a common letter differ significantly (P < 0.05).