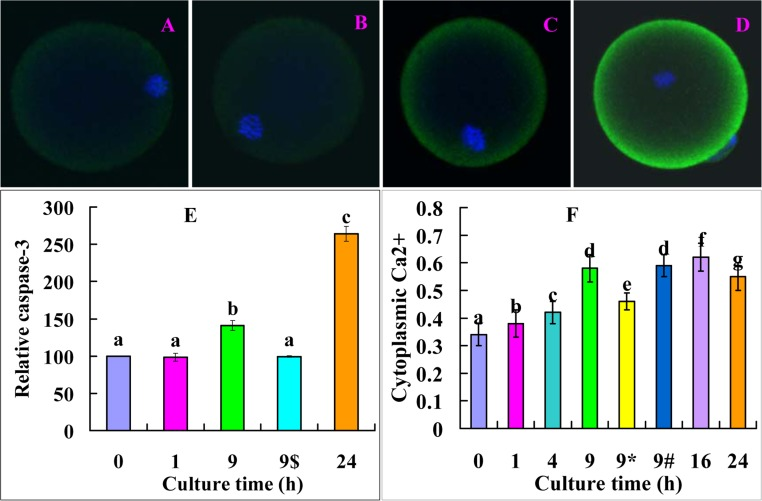
Figure 5.Levels of active caspase-3 and cytoplasmic calcium after oocytes were cultured in FCM for different times. A, B, C and D are confocal microscopic images (original magnification ×400) showing active caspase-3 distribution in oocytes aged in FCM for 0, 1, 9 and 24 h, respectively. E is a graph showing the quantification of active caspase-3 in oocytes aged in FCM for different times. 9$ indicates oocytes aged for 9 h in the presence of 5-μM MG132. Each treatment was repeated 3 times with each replicate containing 15-20 oocytes. F is a graph showing the levels of cytoplasmic calcium in oocytes aged in FCM for different times. 9* and 9# indicate oocytes aged for 9 h in the presence of caspase-3 inhibitor or 5-μM MG132, respectively. Each treatment was repeated 3 times with each replicate containing about 20 oocytes. a-g: values with different letters above their bars differ significantly (P<0.05) within graphs.