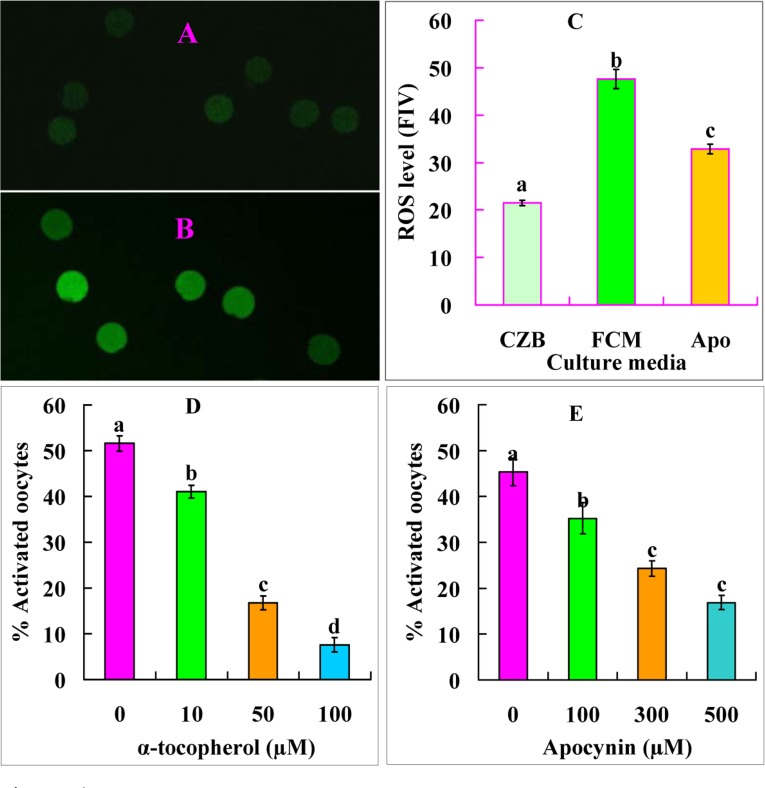
Figure 6.Levels of ROS and ethanol activation rates after mouse DOs were aged for 9 h in different media. A and B are confocal images showing the ROS fluorescence intensity of oocytes aged in CZB and FCM, respectively. C is a graph showing the quantification of ROS (fluorescence intensity value, FIV) in oocytes aged in CZB, FCM or FCM containing 500 μM apocynin (Apo). Each treatment was repeated five times with each replicate containing about 10 oocytes. D and E are graphs showing ethanol activation rates after oocytes were aged in FCM with different concentrations of α-tocopherol or apocynin, respectively. Each treatment was repeated 4 times with each replicate containing about 30 oocytes. a-d: Values with different letters above their bars differ significantly (P<0.05) within graphs.