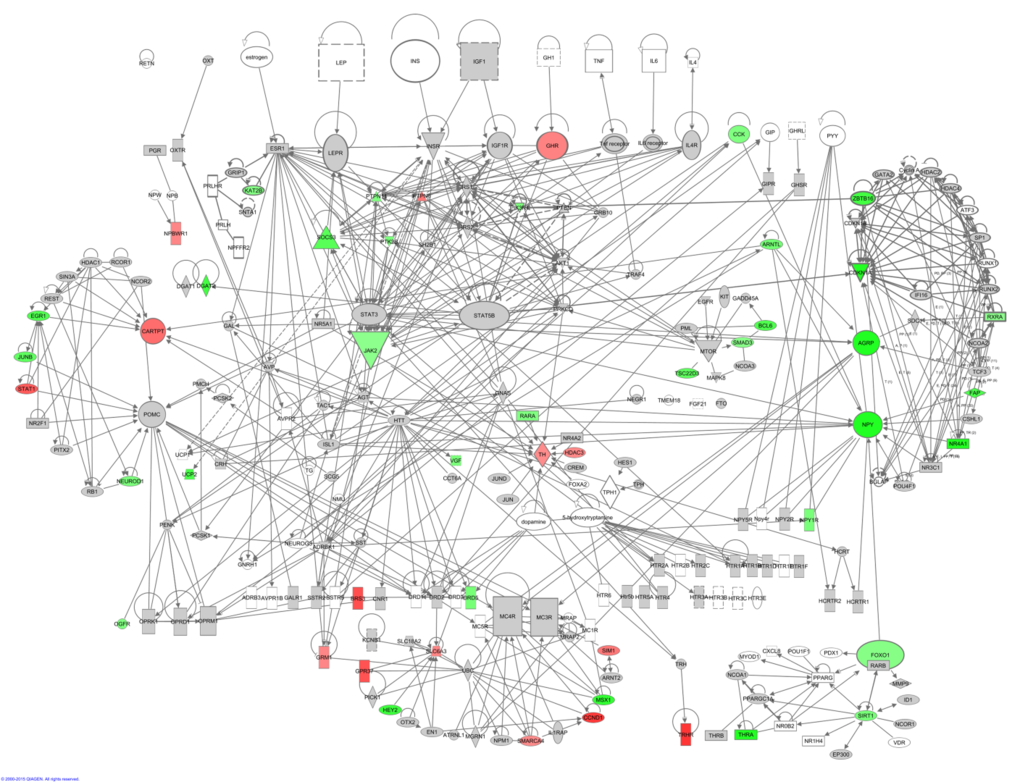
Figure 4.The hunger signaling pathway constructed in the IPA program colored according to genes correlating with circulating leptin levels. Red indicates a positive correlation coefficient and green indicates a negative correlation coefficient. Intensity of the color is related to the strength of the correlation.