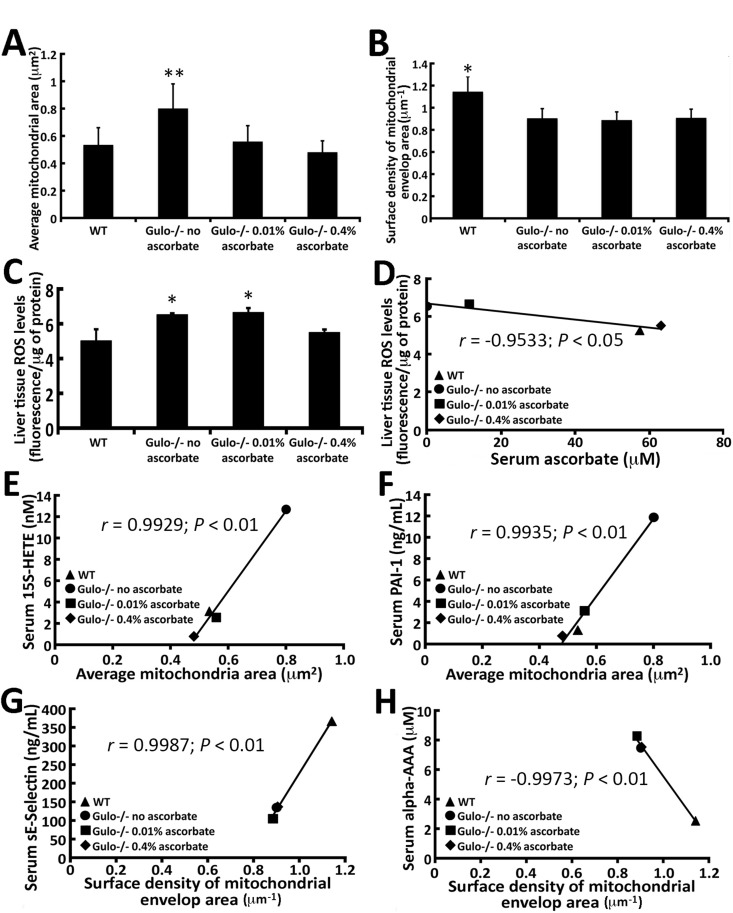
Figure 7.Correlation of mitochondrial morphology in the liver of Gulo−/− mice with different metabolites and cytokines with a r > 0.99 and a P-value < 0.01(A) Graph showing the average mitochondrial dimension in different mouse cohorts. (Tukey post ANOVA test: **P < 0.05 compared to all other groups of mice). (B) Graph showing the average surface density of mitochondrial envelop area in different mouse cohorts. (Tukey post ANOVA test: *P < 0.01 compared to all other groups of mice). (C) Graph showing the ROS levels in the liver of our different mouse cohorts. (Tukey post ANOVA test: *P < 0.05 compared to wild type and 0.4% treated Gulo−/− mice). (D) Correlation between liver ROS levels and serum ascorbate levels. (E) Correlation between serum 15S-HETE and the average mitochondrial dimension in mice. (F) Correlation between serum PAI-1 and the average mitochondrial dimension in mice. (G) Correlation between serum sE-selectin and the average surface density of mitochondrial envelop area in the liver of the different mouse cohorts. (H) Correlation between serum alpha-AAA and the average surface density of mitochondrial envelop area in the liver of the different mouse cohorts. The Pearson's correlation r values and P-values are indicated on each graph.