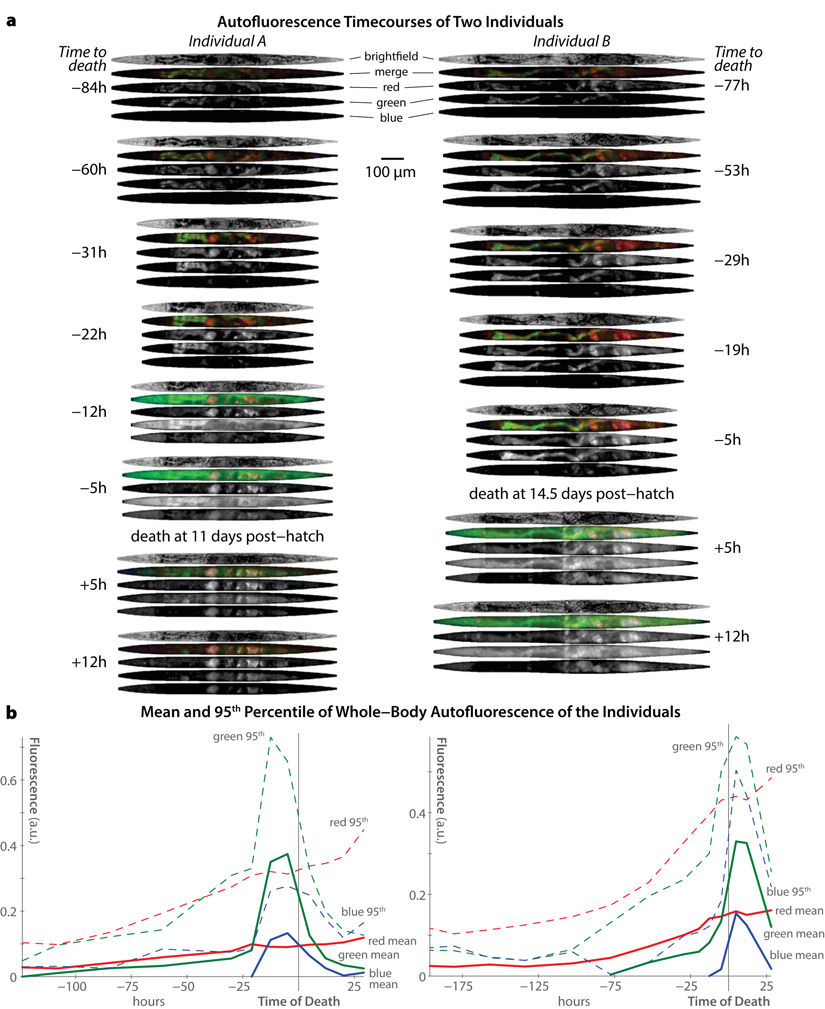
Figure 2.Trends in autofluorescence over time in individual C. elegans(a) Computationally straightened brightfield and fluorescence images of two different individuals (left and right) at selected time-points are shown. The timecourse for each individual is shown top-to-bottom, with images annotate by the number of hours before/after that individual's death. Fluorescence images obtained in the “red”, “green”, and “blue” channels (see Figure 1) are shown individually and in false-color merge images for each time-point. Note the peak in green and blue fluorescence near each individual's time of death (as ascertained by cessation of movement following stimulation). (b) Whole-body fluorescence across the entire experiment is shown for the two individuals pictured in panel a. For each fluorescent channel, the mean and 95th percentile intensity of all image pixels in the animal's body is plotted over time.