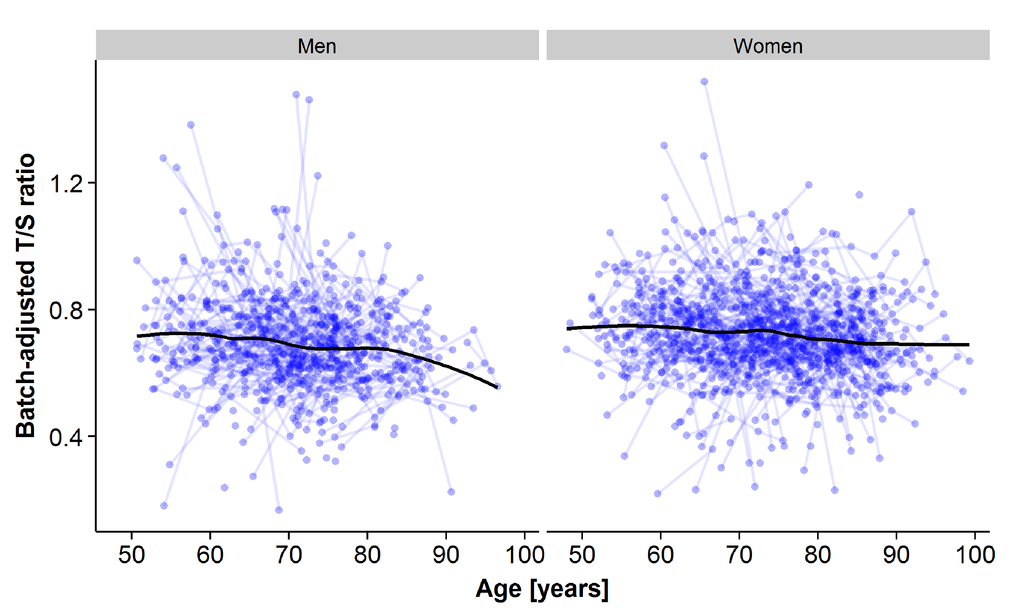
Figure 1.Plots of all leukocyte telomere length (LTL) samples across measurement points for the longitudinal analyses for men (left panel) and for women (right panel). The x-axis represents age at sample testing, and the y-axis represents the plate-adjusted residuals of LTL re-scaled back to T/S-ratio. A loess smoothing line calculated from a weighted regression over age for all samples is shown.