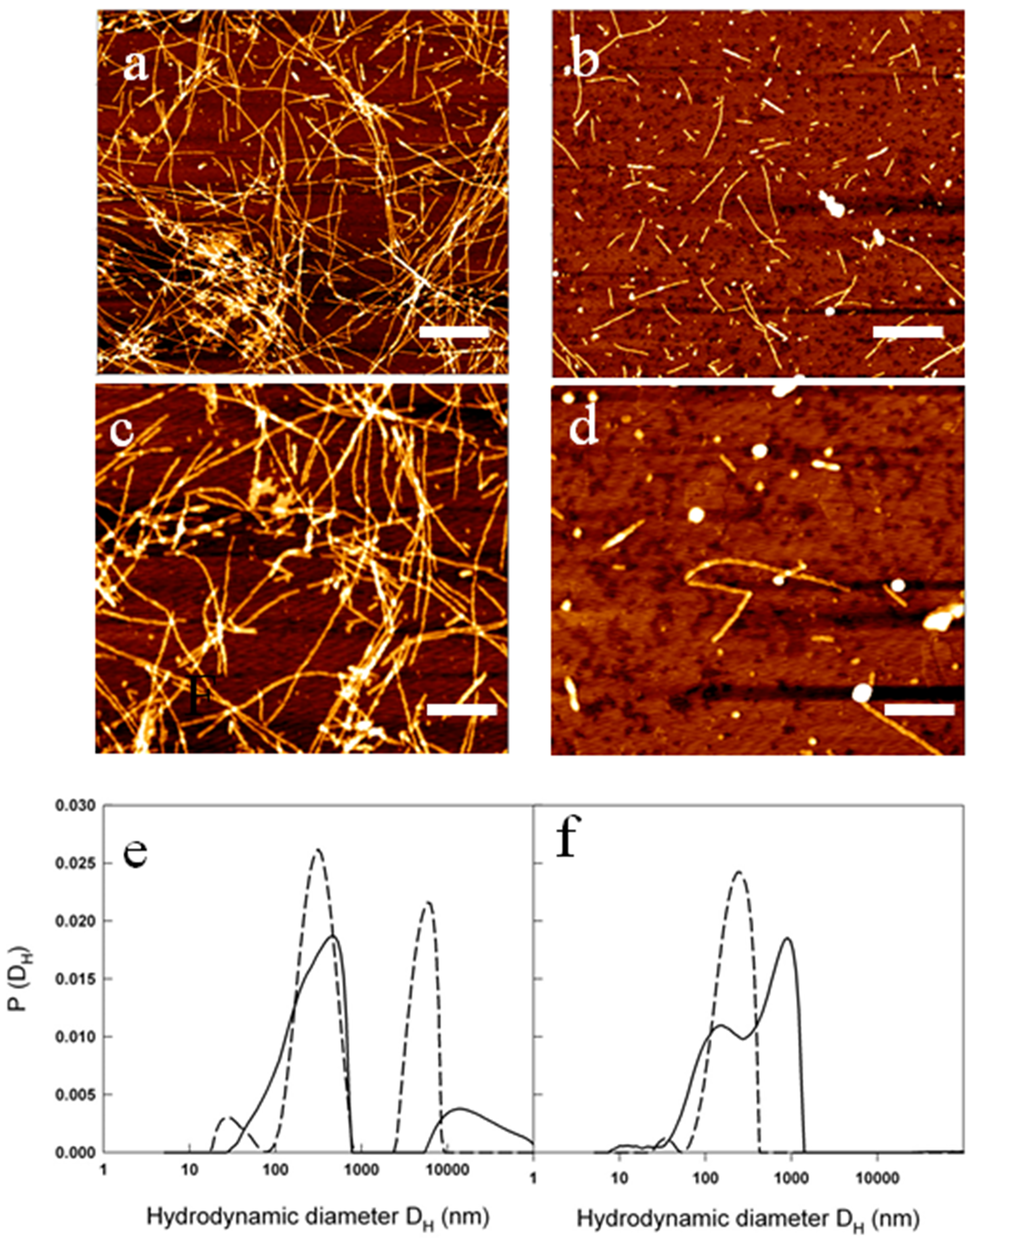
Figure 8.Metformin effects on fibril size and growth. (a-d) AFM images acquired for: 50 µM Aβ1-40 at the end of the kinetics at 37 °C and 200 rpm at two different magnifications: scale bar = 1μm and Z-range = 8.9 nm (a); scale bar = 500 nm; Z-range = 8.3 nm (b). The samples were compared with 50 µM Aβ1-40 + 2 mM metformin at the end of the kinetics at 37 °C and 200 rpm at two different magnifications: scale bar = 1μm and Z-range = 7.0 nm (c); scale bar = 500 nm; Z-range = 8.3 nm (d). Particle size distribution from DLS of 50 µM Aβ1-40 incubated at 37 °C and 200 rpm in the absence (e) and in the presence (f) of 2mM metformin after 0.5 h (dashed lines) and 2 hrs (solid lines) from the beginning of amyloid aggregation process.