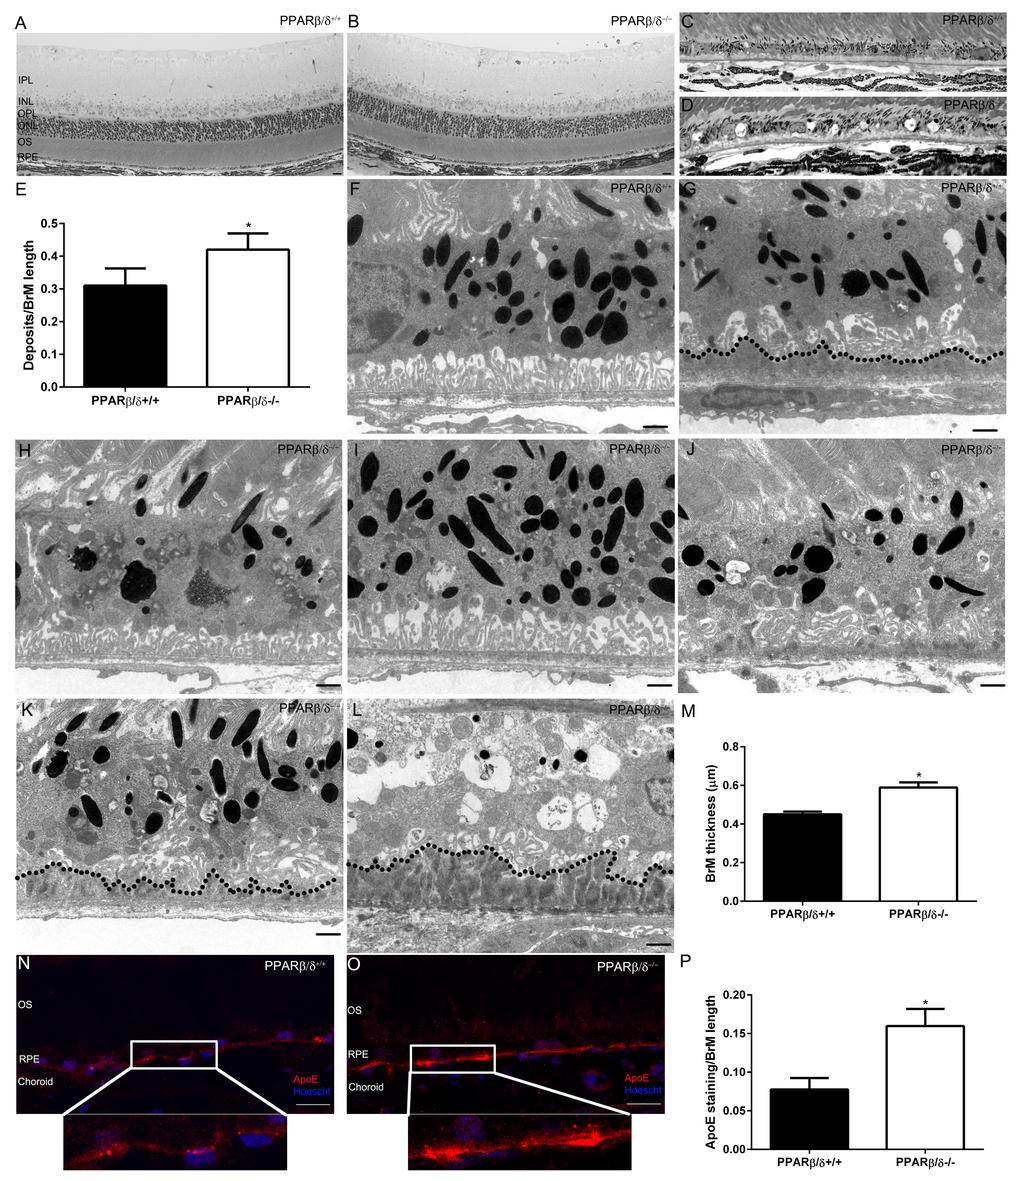
Figure 3.18-month old Pparβ/δ−/− mice exhibit dry-AMD pathology. Toluidine blue stained images of plastic sections from 18-month old (A)Pparβ/δ+/+ and (B)Pparβ/δ−/− mice displaying retinal layers (IPL: Inner plexiform layer, INL: Inner nuclear layer, OPL: Outer plexiform layer, ONL: Outer nuclear layer, OS: photoreceptor outer segments, RPE: Retinal pigment epithelium). Toluidine blue stained images of the outer retina of (C)Pparβ/δ+/+ and (D)Pparβ/δ−/− mice, which have sub-RPE deposits (Scale bar = 10 μm). (E) Quantification of deposits per Bruch’s membrane (BrM) length in plastic sections (mean and S.E.M., n=10 images/animal, n=4/genotype, * p<0.05). Electron micrographs of RPE/Bruch’s membrane/choroidal junction in 18-mo-old Pparβ/δ+/+ mice display (F) normal RPE morphology (G) with some age related deposits (dotted line), whereas 18-mo-old Pparβ/δ−/− mice show (H) RPE hypo-pigmentation, (I) hyper-pigmentation and (J) abnormal basal infoldings with thin sub-deposits, (K) loss of basal infoldings with thin and (L) thick sub-RPE deposits (dotted line). (M) Quantification of Bruch’s membrane thickness in electron micrographs of Pparβ/δ+/+ and Pparβ/δ−/− mice (n = 10 images per mouse, n = 4 mice per genotype, two tailed t-test). Scale bars in panels F-L: 1 μm. Images of apolipoprotein E (apoE; red) stained sections from (N)Pparβ/δ+/+ and (O)Pparβ/δ−/− mice (Scale bar: 20 μm). Nuclei are stained with Hoescht (blue). (P) Quantification of ratio of apoE stained regions/Bruch’s membrane length (mean and S.E.M., n=4 per group, * p < 0.05, two tailed t-test).