Submit an Article
Navigate
Home
Editorial Board
Editorial Policies
Current Volume
Archive
Scientific Integrity
Publication Ethics Statements
Interviews with Outstanding Authors
Newsroom
Sponsored Conferences
Podcast
Contact
Special Collections
Submit an Article
Online ISSN: 1945-4589
Research Paper
|
Volume 8, Issue 10
|
pp. 2437–2448
Clustering of geriatric deficits emerges to be an essential feature of ageing - results of a cross-sectional study in Poland
Back to article
Figure 2
(2 of 2)
−
100%
+
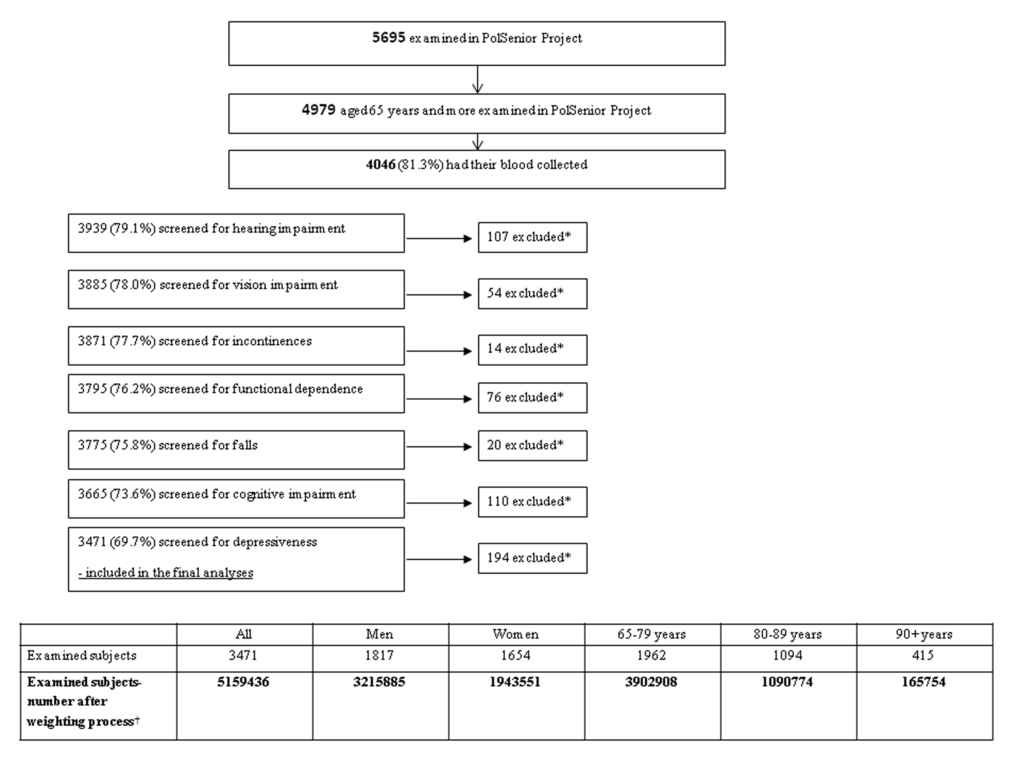
Figure 2.
Group selection process. * Exclusion due to lack of complete data. † Weights for gender and age have been applied to produce nationally representative estimates for population aged 65 years and older.