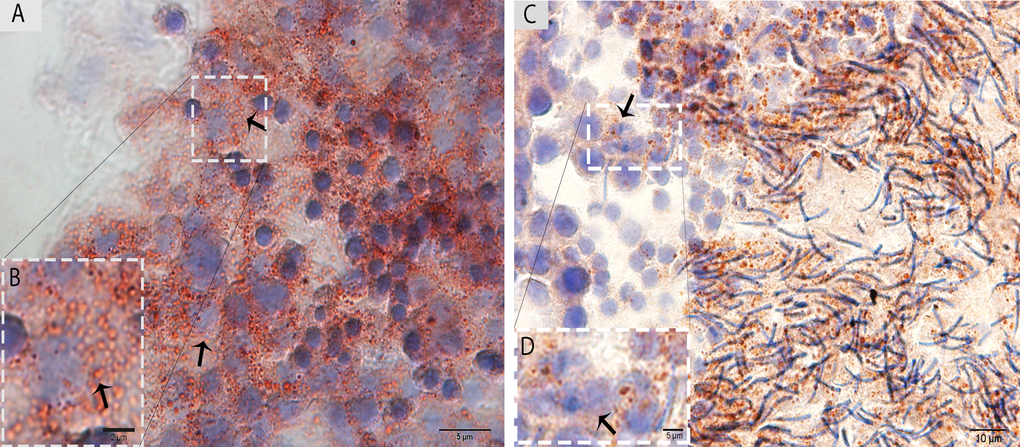
Figure 3.Light micrograph of Oil Red O staining in the testis. (A)The ORO staining shows a large number of lipid droplets in the Sertoli cells (arrow) in May. (B) A higher magnification of the rectangular area. (C) Lower numbers of lipid droplets in the Sertoli cells (arrow) in October are observed. (D) Illustration of the rectangular area. Scale bar= 10μm (A, C), 2μm (B) and 5μm (D).