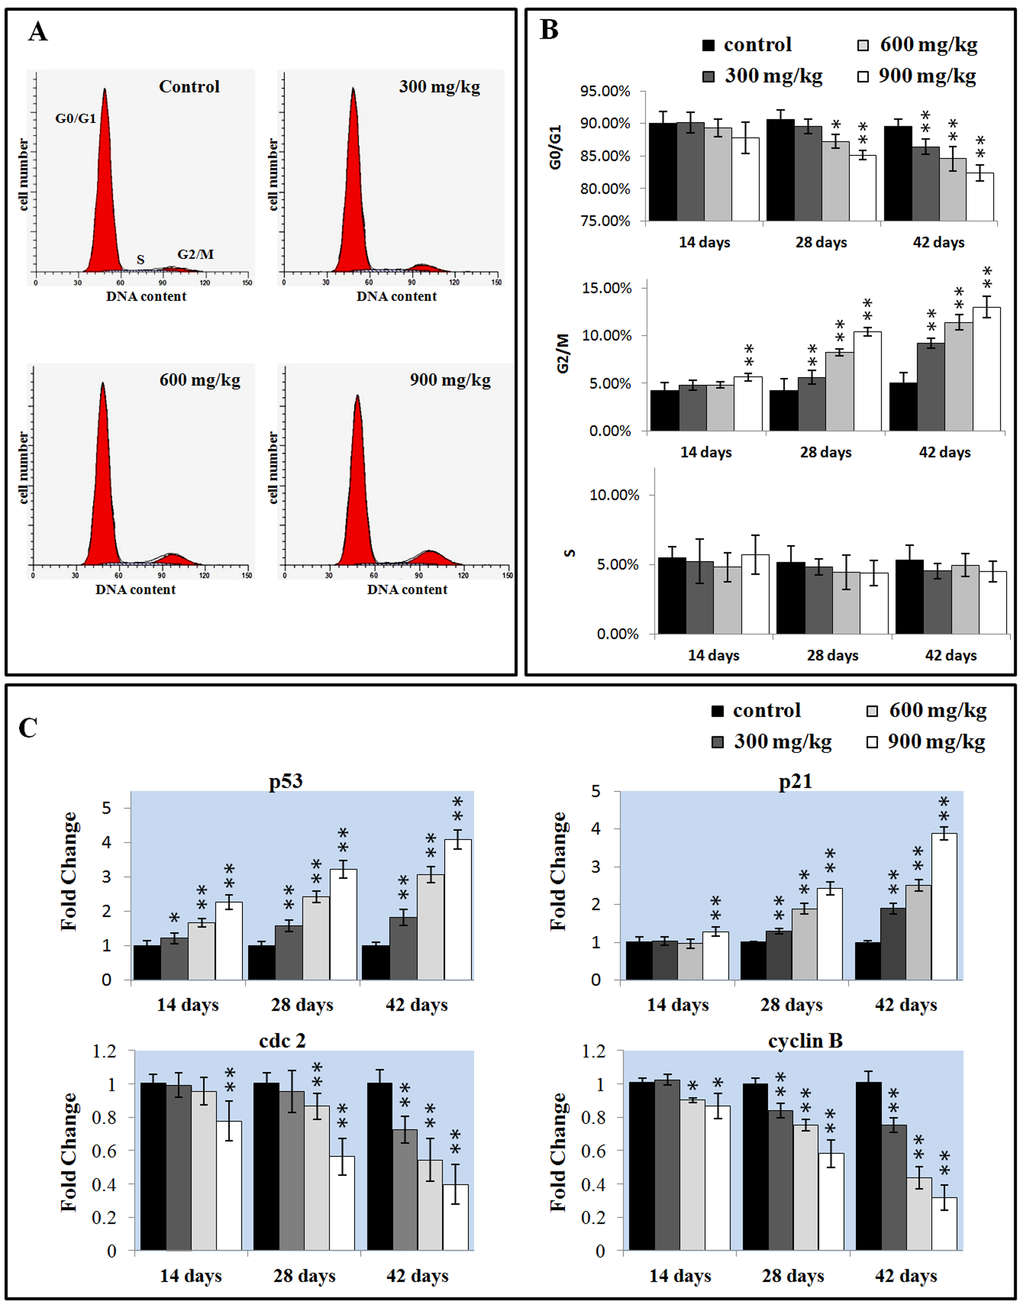
Figure 6.Changes of the cell cycle in the liver. (A) Representative flow cytometric diagram of cell cycle analysis. (B) Changes of the percentage of G0/G1, G2/M, and S phase in the liver. (C) Changes of the G2/M phase regulators mRNA expression levels. Data are presented with the mean ± standard deviation (n=5). *P<0.05, compared with the control group. **P<0.01, compared with the control group.