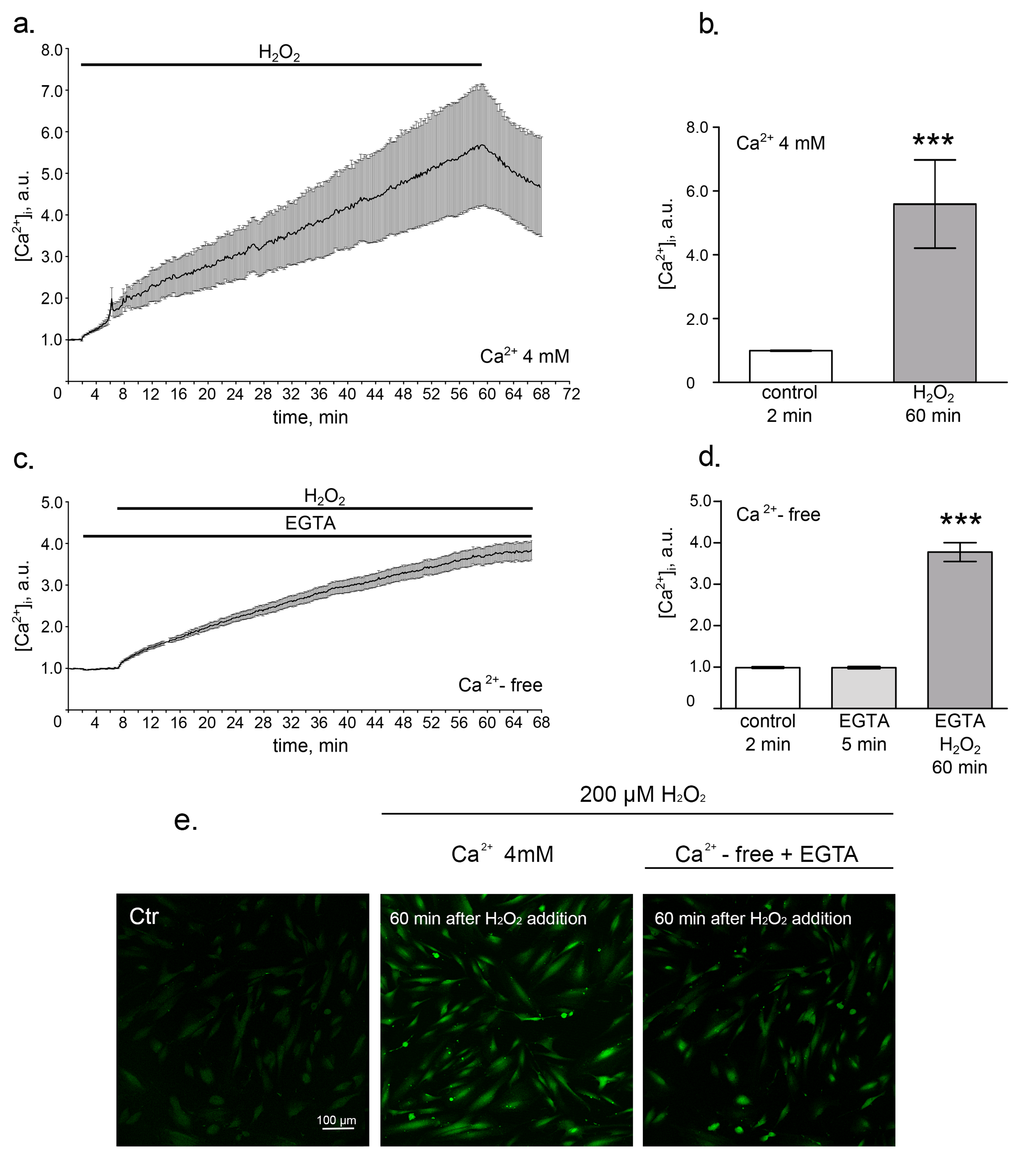
Figure 1.Oxidative stress induces intracellular calcium increase. hMESCs were treated with 200 µM H2O2 for 1 h and intracellular calcium levels were determined using Fluo-3 imaging techniques. (a) Time course of the relevant increase of [Ca2+]i during 1 h H2O2 treatment in Ca2+-containing solution. Number of cells = 24. (b) Histogram, based on the data from (a), reflecting the relevant values of [Ca2+]i on 2 min in control and on 60 min after H2O2 addition. (c) Time course of the relevant increase of [Ca2+]i during 1 h H2O2 treatment in Ca2+-free solution containing 4mM EGTA. Number of cells = 28. (d) Histogram, based on the data from (c), reflecting relevant values of [Ca2+]i in Ca2+-free basic solution on 2 min in control, on 5 min of EGTA action and on 60 min of H2O2 action. (e) Confocal images of hMESCs loaded with Fluo-3AM on 2 min of control, on 60 min of H2O2 action in Ca2+-containing solution and on 60 min of H2O2 action in Ca2+-free solution with EGTA. Scale bar is 100 µm and valid for all images. Values are M ± Std.Er. *** p<0.0001 by Mann-Whitney test. Application intervals and duration are marked with black lines above the graphs. Ctr – untreated cells. Representative results of three independent experiments are shown.