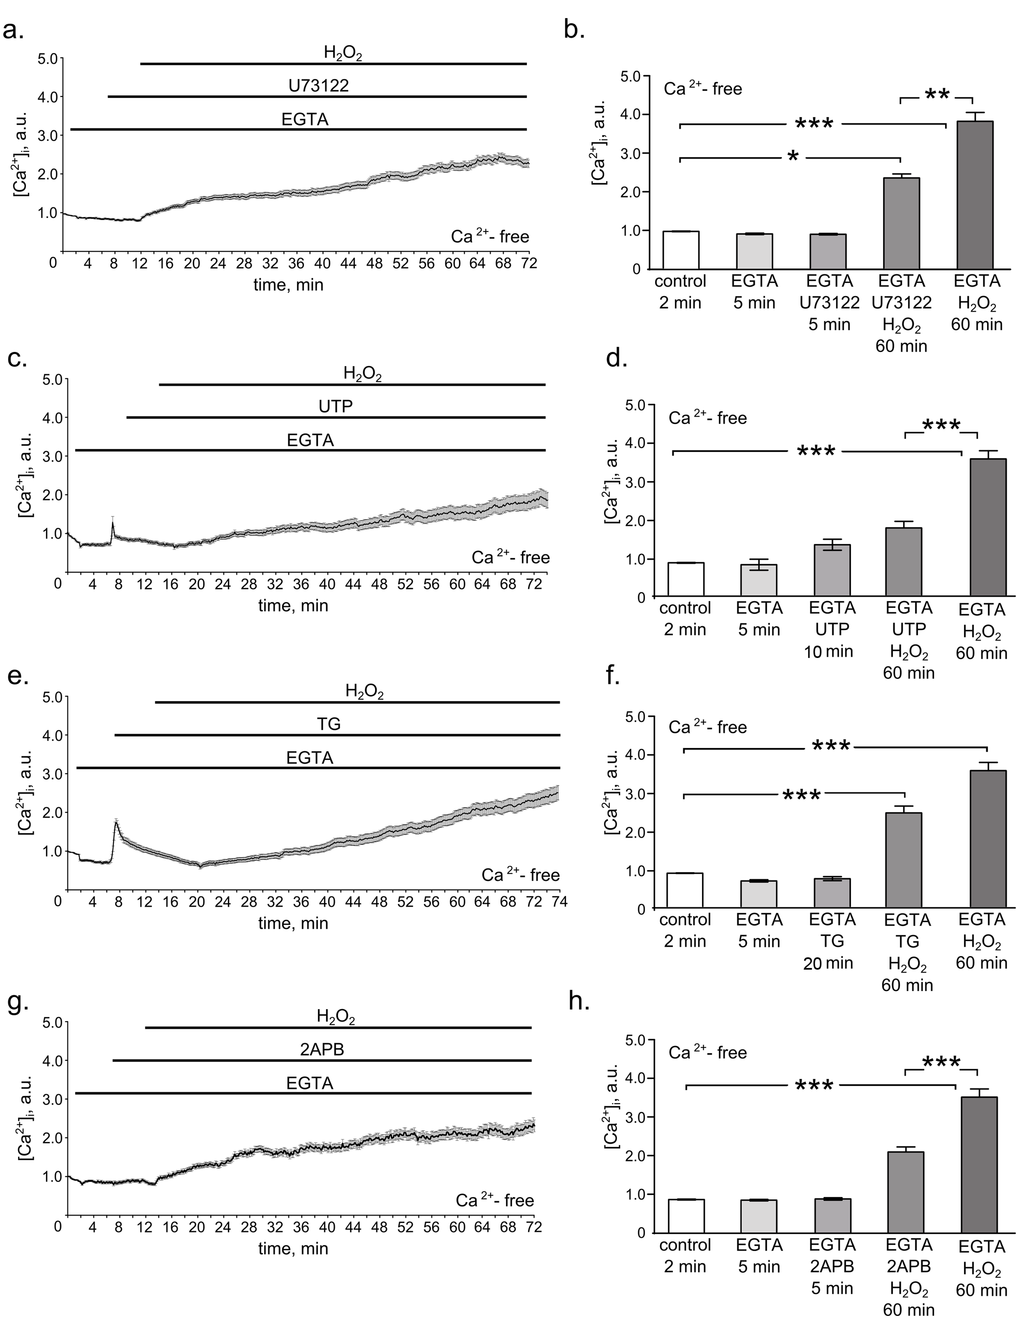
Figure 2.PLC/IP3/IP3R pathway mediates H2O2-induced intracellular calcium elevation in hMESCs. All measurements were done in Ca2+-free basic solution supplemented with 4 mM EGTA in 2 min after the beginning of the imaging, which further was present throughout the whole experiment. (a) Time course of the relevant [Ca2+]i increase during 5 min of 1 µM U73122 pretreatment followed by 60 min of 200 µM H2O2 stimulation. (b) Histogram based on the data from (a), reflecting the relevant values of [Ca2+]i on 2 min in control, on 5 min of EGTA alone action, on 5 min of U73122 action, on 60 min of U73122 + H2O2 action, and on 60 min of H2O2 alone action. Number of cells = 24. (c) Time course of the relevant [Ca2+]i increase in H2O2-stimulated hMESCs pretreated with 100 µM UTP for 10 min. (d) Histogram, based on the data from (c), reflecting the relevant values of [Ca2+]i on 2 min in control, on 5 min of EGTA alone action, on 10 min of UTP action, on 60 min UTP + H2O2 action, and on 60 min of H2O2 alone action. Number of cells = 29. (e) Time course of the relevant [Ca2+]i increase during 20 min of 1 µM TG pretreatment followed by 60 min of 200 µM H2O2 stimulation. (f) Histogram based on the data from (e), reflecting the relevant values of [Ca2+]i on 2 min in control, on 5 min of EGTA alone action, on 20 min of TG action, on 60 min TG + H2O2 action, and on 60 min of H2O2 alone action. Number of cells = 31. (g) Time course of the relevant [Ca2+]i increase in H2O2-stimulated hMESCs pretreated with 50 µM 2-APB for 5 min. (h) Histogram based on the data from (g), reflecting the with relevant values of [Ca2+]i on 2 min in control, on 5 min of EGTA alone action, on 5 min of 2-APB action, on 60 min 2-APB + H2O2 action, and on 60 min of H2O2 alone action. Number of cells = 28. Results are shown as M ± Std.Er. *p<0.05, **p<0.001, ***p<0.0001 by Mann-Whitney test. Application intervals and duration are marked with black lines above the graphs. Representative results of three independent experiments are shown.