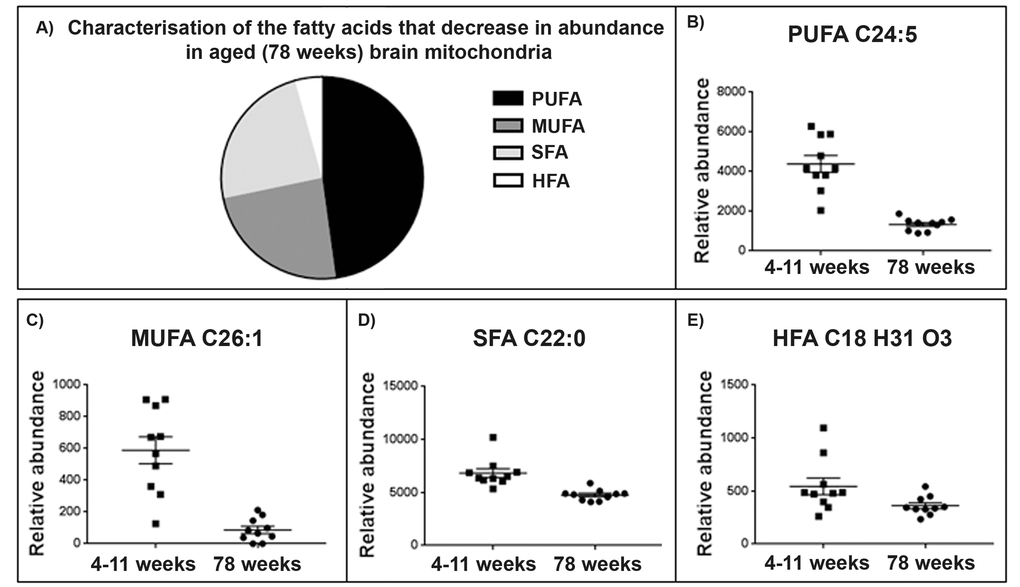
Figure 4.Brain mitochondrial fatty acid composition decreases with ageing. (A) Characterisation of fatty acid species that decrease in the ageing brain mitochondria. 94% of the fatty acids identified (Supplementary Table 5) decrease with ageing in the brain mitochondria. 48% of the fatty acids found to decrease were identified as polyunsaturated fatty acids (PUFA), 24% were saturated fatty acids (SFA), 24% monounsaturated fatty acids (MUFA) and a small percentage, 4%, were identified as hydroxy fatty acids (HFA). (C) Representative scatter plot for the lipid m/z 357.2796, tentatively identified as PUFA C22:5. This lipid shows a significant decrease in abundance in 78 week old brain mitochondria (n=10) compared to 4-11 week old brain mitochondria (n=10), p=0.048. (D) Representative scatter ploy for the lipid m/z 393.3732, tentatively identified as a C26.1 MUFA shows a decrease in abundance aged brain mitochondria. (E) Representative scatter plot for the saturated fatty acids. The lipid m/z 339.3264, tentatively identified as SFA C22:0 decreases in abundance in aged brain mitochondria. (F) Representative scatter plot for the lipid m/z 295.2274 tentatively identified as HFA C18 H31 O3. This lipid decreases in abundance in aged brain mitochondria. Scatter plots display abundance ± SEM. We used Wilcoxon Rank test and Bonferroni correction. Refer to Supplementary Table 5.