Submit an Article
Navigate
Home
Editorial Board
Editorial Policies
Current Volume
Archive
Scientific Integrity
Publication Ethics Statements
Interviews with Outstanding Authors
Newsroom
Sponsored Conferences
Podcast
Contact
Special Collections
Submit an Article
Online ISSN: 1945-4589
Research Paper
|
Volume 9, Issue 3
|
pp. 999–1011
Long non-coding RNA LOC100129148 functions as an oncogene in human nasopharyngeal carcinoma by targeting miR-539-5p
Back to article
Figure 2
(2 of 8)
−
100%
+
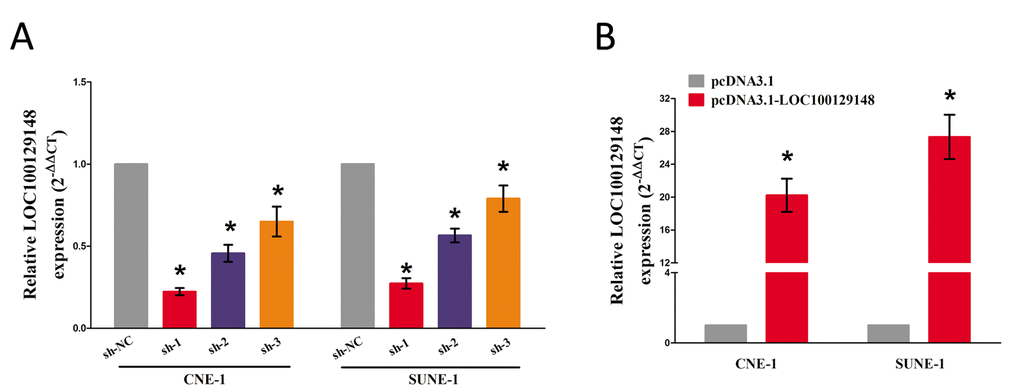
Figure 2.
(A-B)
Relative LOC100129148 expression after transfection with sh-LOC100129148 or pcDNA3.1-LOC100129148.